In a previous blog, I walked you through and showed you how easy it was to create a ControlUp for Compliance template that automatically scans all or a subset of the desktop devices in your environment. I suggest you read it as this blog builds on that blog.
In this blog, I will introduce you to the Issues dashboard, where you can see what issues were found during the scan and how easy it it to remediate them.
On the ControlUp for Compliance dashboard, click the Issues tab. This will give you an overview of issues you should address.

The top of this dashboard has two widgets: a graph of issues over time and the issues by category: misconfigurations, vulnerability, and compliance.
Finding Issues on a Device
The two top widgets give a high-level overview of an environment’s entire health, but we want to get into the details of the specific problems on specific devices; this is what the lower grid is used for.
The most useful column in the Issues grid is the Score, which shows the severity, category, and number of devices affected by the issues that ControlUp for Compliance has identified. We refer to this as Smart Prioritization.
The grid’s columns are sortable and filterable. In my case, I filtered by the Critical column and then by the Score column.

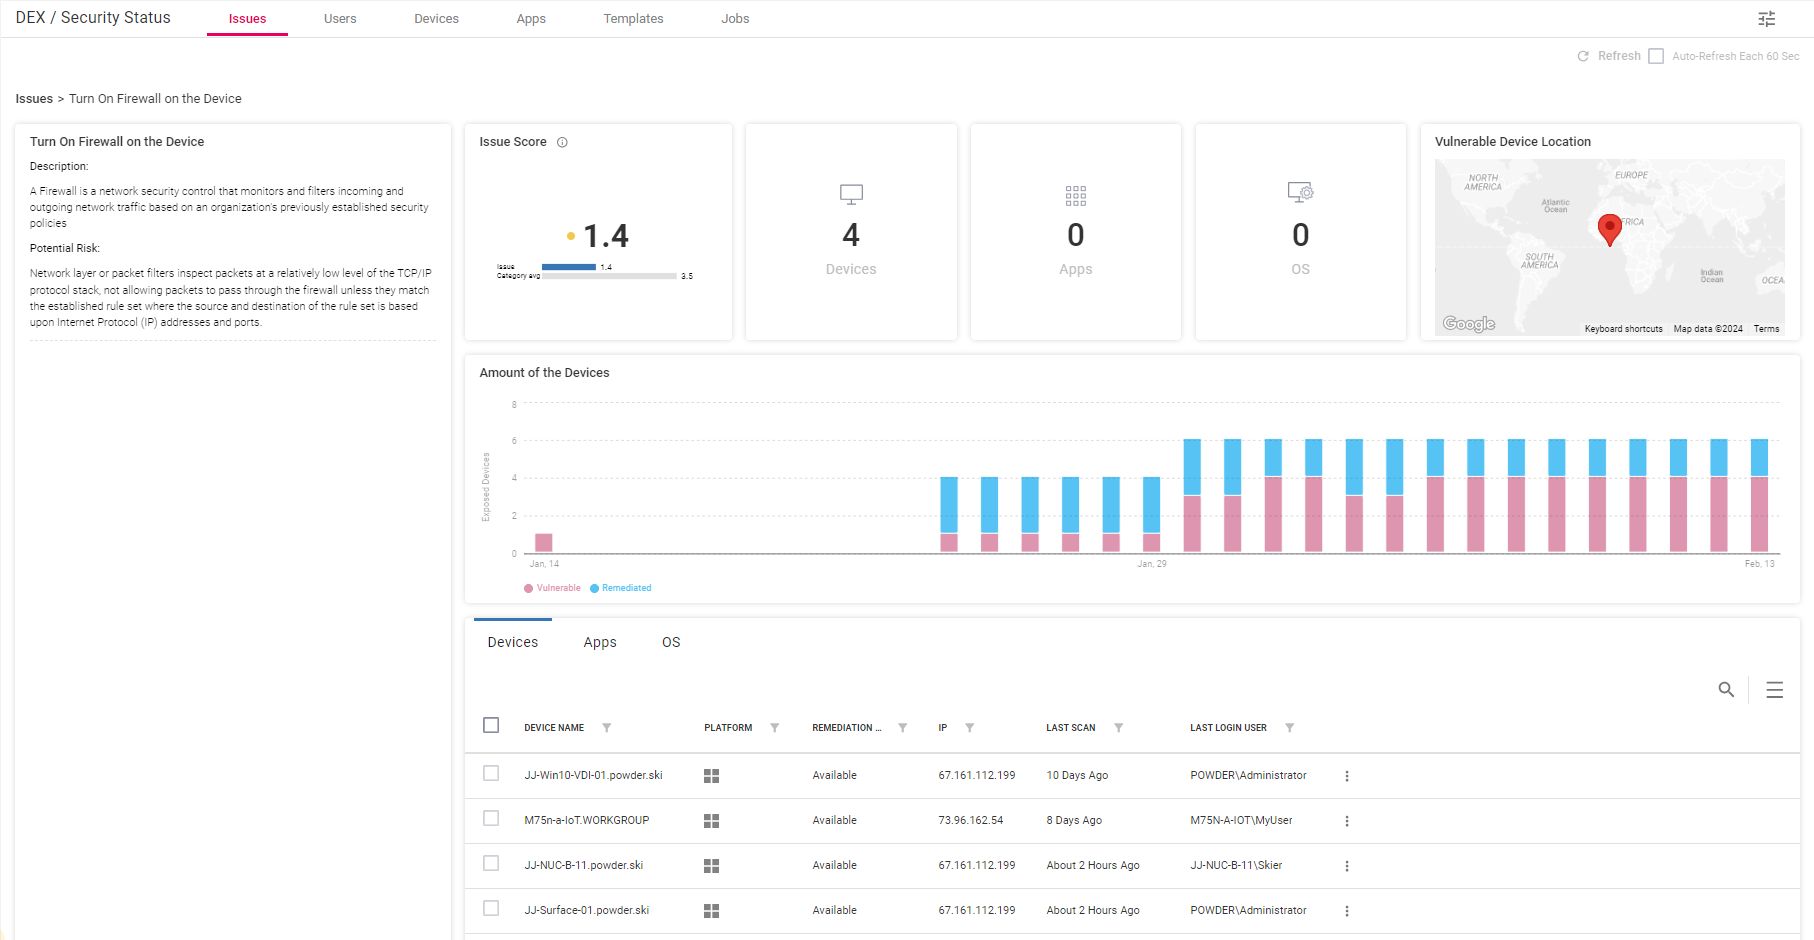
The best way to understand this grid is through an example. As I wanted a problem that I could fix I set my grid filters to a Critical severity with an Available remediation. On the grid I see an issue with firewalls being turned off. There are many reasons may people may turn off their firewall, for example I turn off my firewalls when debugging problems. The devices column shows that four devices have their firewall turned off.

I clicked “Turn on Firewall on the Device.” This brings up a detailed dashboard on this issue, including the devices that have this issue, where they are located, and if any apps or OSes are affected by it, as well as a timeline graph of the number of devices that have it.

The timeline shows that more and more devices have had this issue over time.
I selected the devices that I wanted to fix and then selected Remediate from the Action drop-down menu

Fixing Issues
This brings me to a job panel where I can fix the issue immediately or schedule the device to be remediated by having the firewall turned on.

Other Ways to Fix Issues
There are other ways issues can be remediated as well. For example, you can do it from the Issues main dashboard.

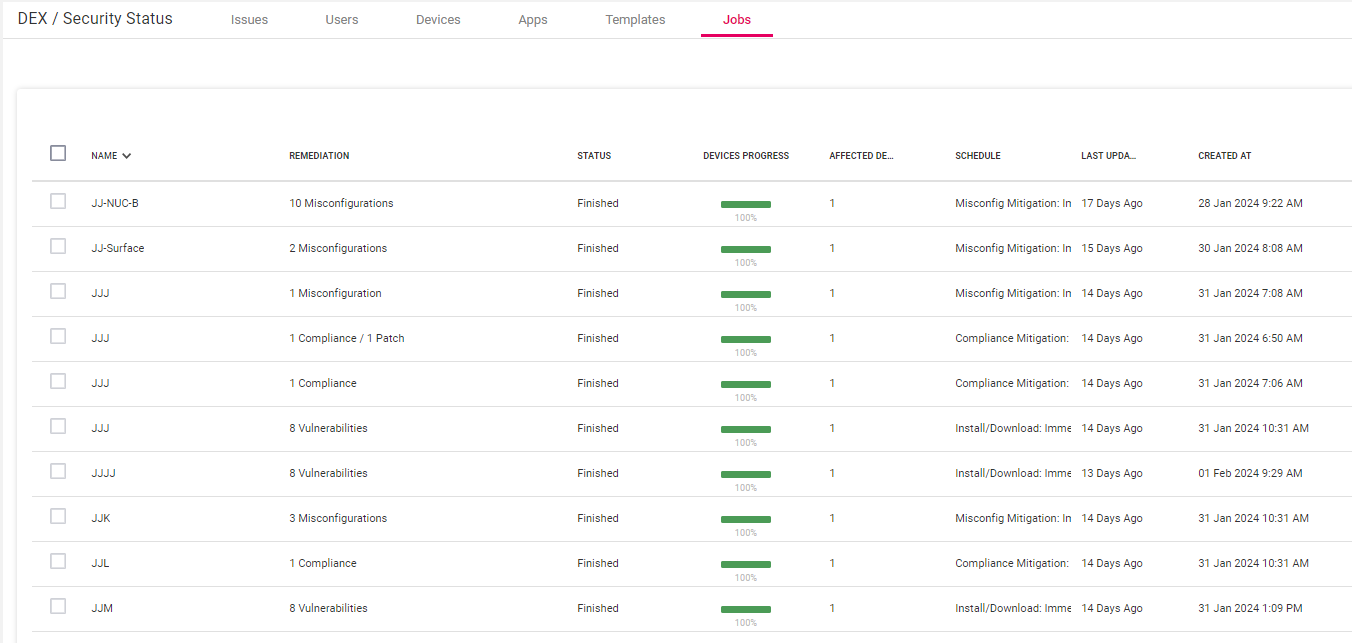
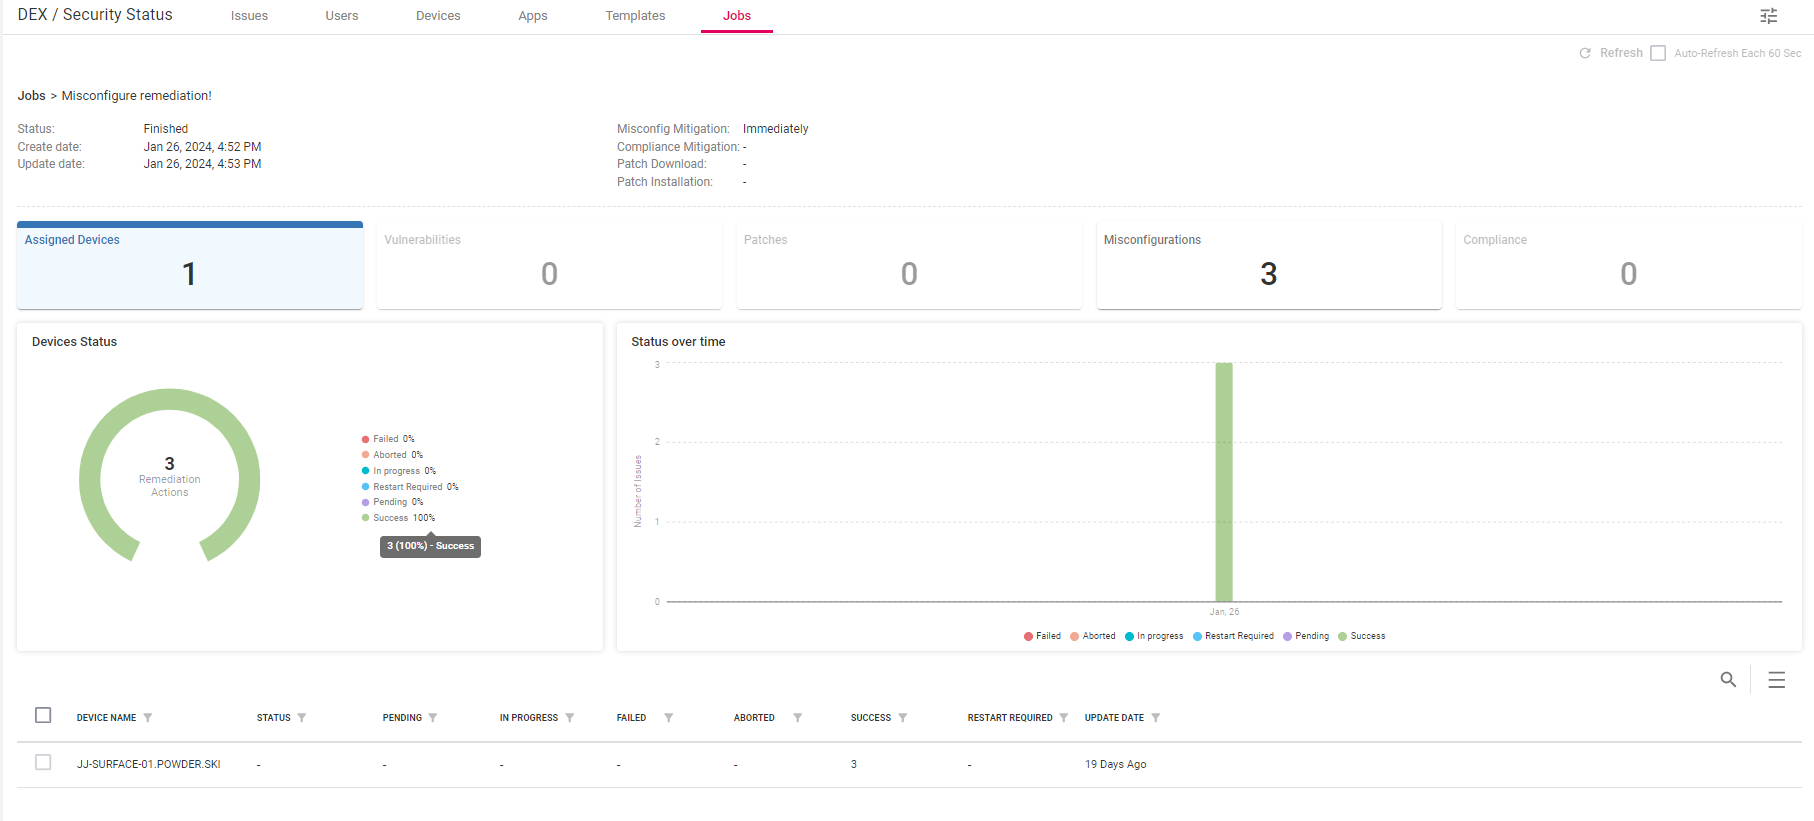
Clicking the Jobs tab will show you more information about the jobs, such as their status, and let you click a job to get more information about it.

Failure is Not an Option
The most important thing I found on a job’s dashboard is if any devices failed to be remediated. If the job did fail, it might need manual investigation and remediation.

Organizations must ensure that devices are as safe as possible, and ControlUp has greatly simplified this process by using ControlUp for Compliance templates and jobs.
My next blog will examine how ControlUp for Compliance works with users, devices, and applications.
For more information on ControlUp for Compliance or any of our other award-winning products or to schedule a personal demo, click here.