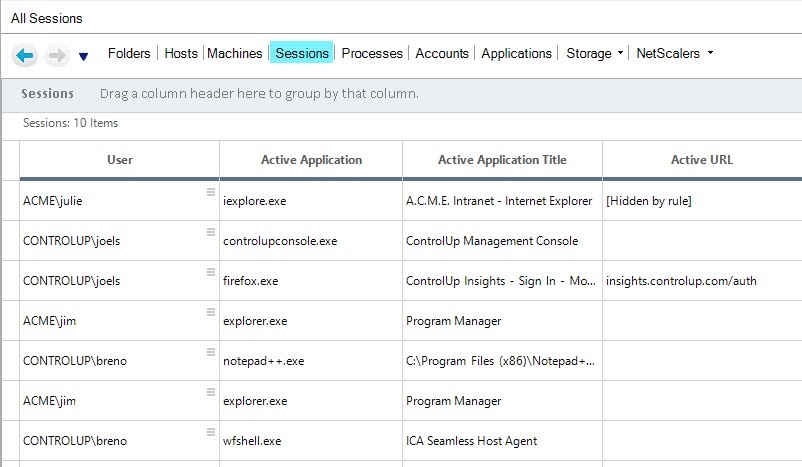
The ControlUp Real-Time Console provides a live look at over 900 metrics and data points across a host of endpoints, including hypervisors, Citrix and VMware EUC platforms, machines, IGEL devices, Citrix Networking appliances—and more—in your environment. Many of these are also available as historical and trending data through our dashboards and reports in ControlUp Insights.
We continuously evaluate new, relevant metrics to include in our solution to help our customers improve their monitoring, troubleshooting, and reporting. Some recent examples include a wide range of VMware Horizon metrics, as well as Windows User Input Delay.
Two new data points, included in our recent 8.1.5 release, are Active Application and Active Application Title. And we also made improvements to a data point that is relevant in the same context: Active URL.

Accessible from the Session View, the information we provide for these are:
- Active Application: The executable name of the application that is currently in the foreground
- Active Application Title: The window name of the application currently running in the foreground
- Active URL: Displays the URL or typed text in the address bar if the Active Application is one of the following browsers: Google Chrome, Microsoft Edge, Internet Explorer, or Mozilla Firefox. This information was previously only exposed as “Browser URL” and only for Internet Explorer in the Processes View
Configuration
To meet regulatory requirements, as well as privacy rules or laws in certain industries and countries, it is possible to restrict what information ControlUp can monitor. You can either enable or disable monitoring altogether for both the Active Application Title and URL metrics or you can configure rules that will limit which Application Titles and URLs are visible in the Console.
To configure filtering for Active Application Title, head over to the ControlUp Settings tab and select Active Application. Once there, you can enable or disable the feature (1) or, if enabled, can add rules to ignore or display based on keywords in the Active Application Title (2).

Similarly for the Browser URL Settings, the feature can be disabled altogether (3) or, if enabled, restricted through rules. In this case, the rules can be configured to evaluate the domain pattern (* wildcards are supported) and will allow you to set what part of the URL is logged and made visible in the Console (4).

For both configurations, in the case of multiple rules, they are evaluated from top to bottom until the first match is found.
Using these metrics in Automated Actions
Besides the ability to look at specific information pertaining to the Active Application, Title and URL metrics in real time (using the “grid” in the Real-Time Console), the availability of these metrics also enables you to use them in combination with one of the most powerful features of ControlUp: Automated Actions.
To create an Automated Action, you define a Trigger (a set of conditions that are true and/or not true) and tie it together with an action, such as sending an email notification or launching a script through our Script-based Actions feature. You can use almost any of the 900+ metrics available in the Console to create a condition, including the ones that are described here.
Some use cases worth exploring include:
- Send a notification to the Windows Action Center of the user’s session when a specific application is active in the foreground for a certain amount of time. This could be useful when rolling out new applications or onboarding new users
- Instructing users to use a different browser for certain web pages or web/SaaS applications that require specific browsers. For example, sending an on-screen notification stating to use Chrome or Edge when the ControlUp Insights URL is opened in Firefox (which is an unsupported browser for Insights)
To illustrate the first use case, check out this short video highlighting the configuration and user experience.
If you have a good idea for new metrics, let us know! You can reach out to your Sales Rep or Sales Engineer, hit us up on social media, or make a request right in the Console from the Help menu.

