Today’s modern, dispersed remote workforce relies on the network to communicate and accomplish daily tasks. When a network has subpar performance, it can affect individual users, a branch office, or even your entire organization!
Edge DX’s Network Latency dashboard is a powerful tool that allows you to monitor your network and investigate the individual endpoint devices experiencing issues.
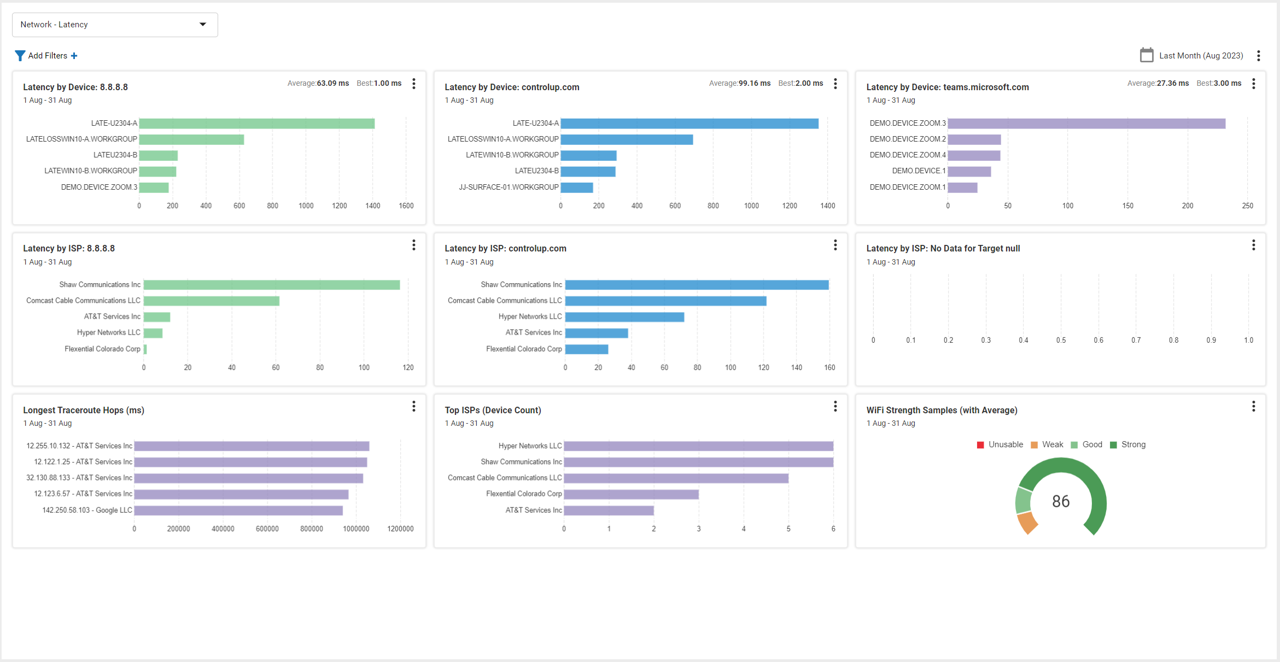
Like other Edge DX dashboards, the Network Latency dashboard (Figure 1) can be accessed from within the Dashboard tab.
 Figure 1: Figure 1: Network Latency Dashboard
This dashboard tracks the latency from each device to a known network location. It then aggregates these results and displays this information by device ISP. It also displays the devices with the longest traceroute and the overall Wi-Fi signal strength.
Devices Latency
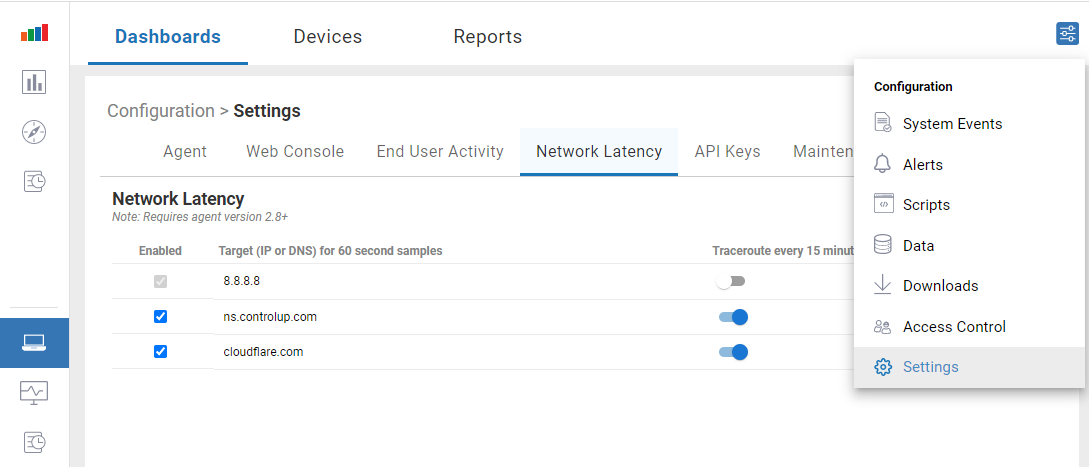
The network locations (Figure 2) tested against can be set by selecting Setting in the Configuration drop-down menu and then selecting the Network Latency tab. This allows you to specify the locations that are most important to you.

Figure 2: Network Locations
To identify the devices with the worst latency, the Latency by Device widget shows a bar graph with the five devices with the worst latency (Figure 3). If you hover over a device, a popup will appear with the average latency for that device.

Figure 3: Latency to 8.8.8.8
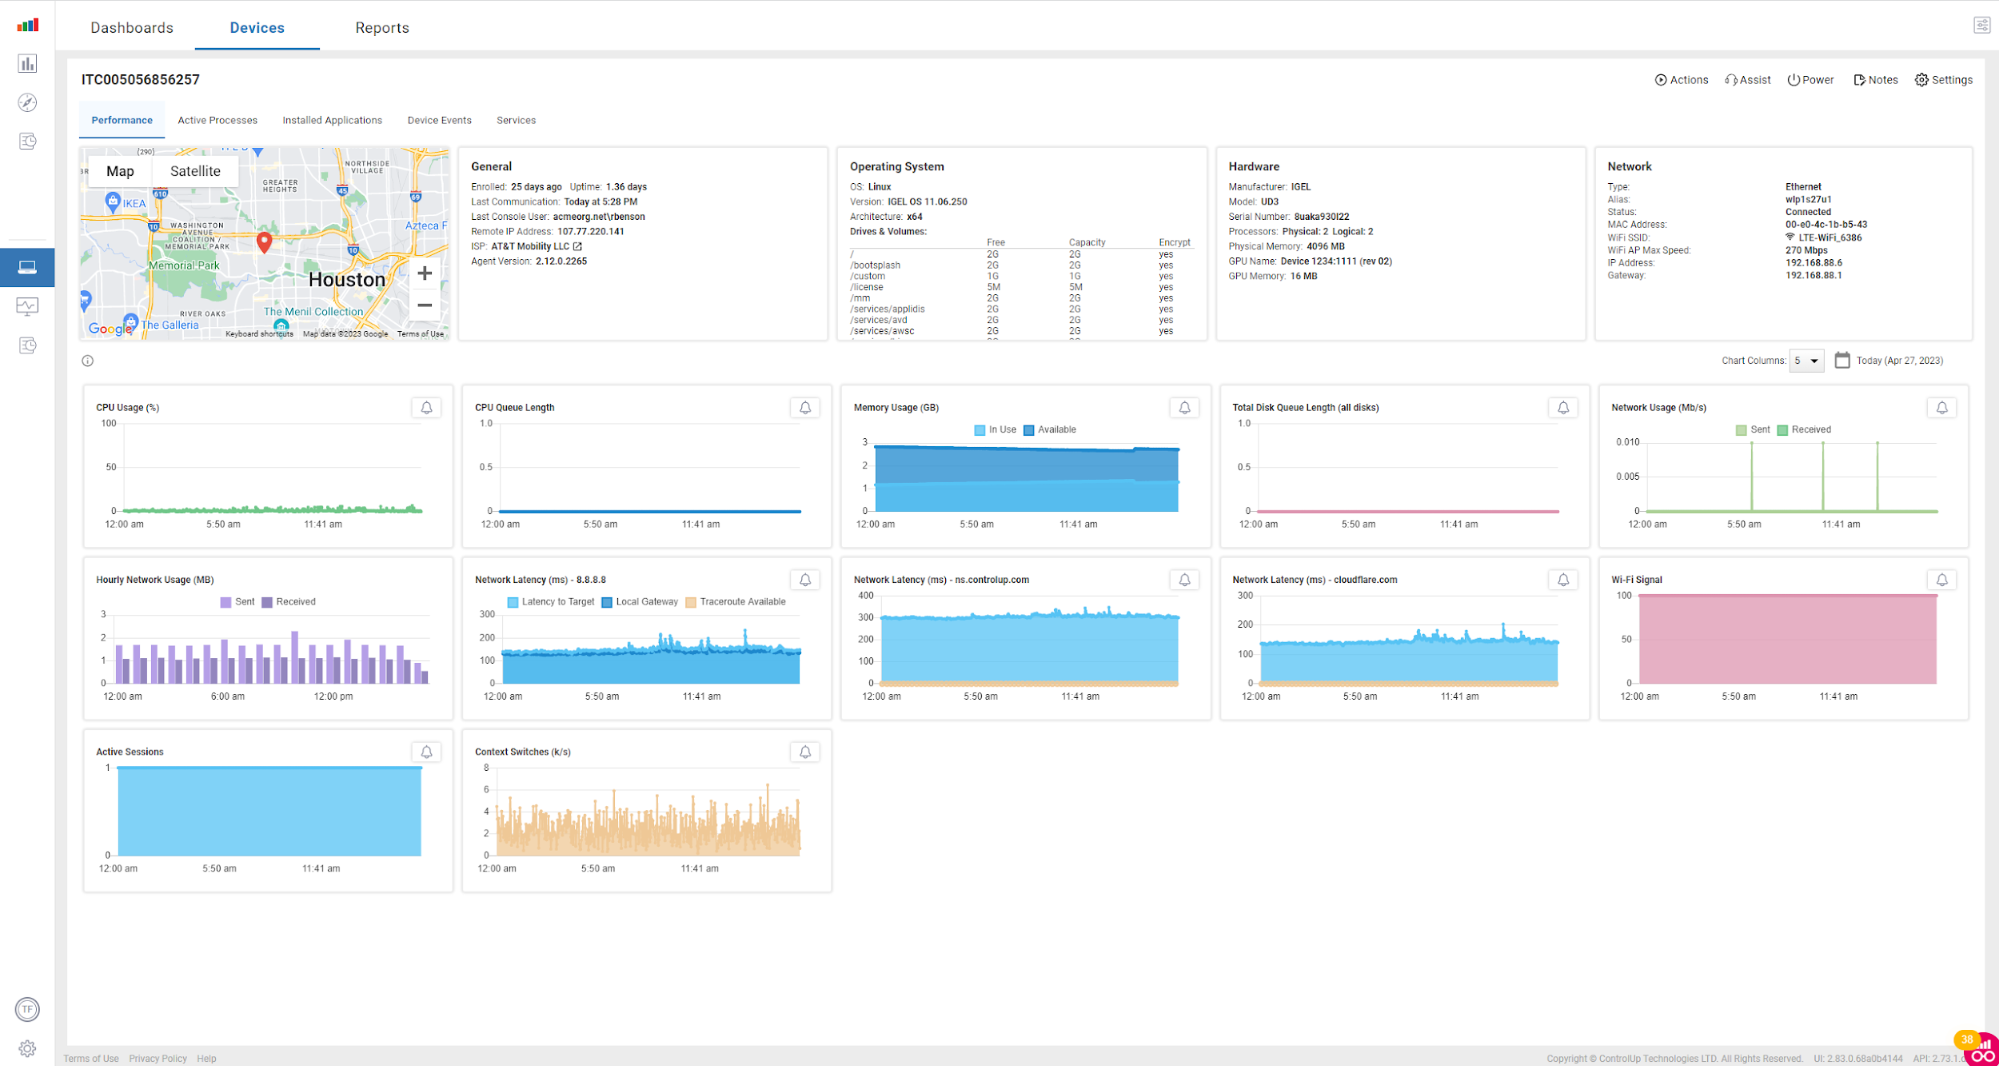
Clicking the device in the widget will bring you to that device’s home page (Figure 4) so you can gain further insights and investigate it further.
 Figure 4: Devices Home Page
ISP Latency
The latency may be tied to the ISP, so the device information is aggregated by the ISP and displayed in a widget to identify if a particular ISP has latency issues (Figure 5).

Figure 5: Latency by ISP
In the screenshot above, it should be noted that the two ISPs with the highest latency are wireless carriers.
It’s All About the Hops
knowing that you have latency issues is just the first step. You then need to identify where the latency is. Due to the internet’s robust design, connecting one device to another can take many different routes as the network packets are passed from one router to another.
To help diagnose the route a network packet travels, traceroute was invented. The traceroute command sends Internet Control Message Protocol (ICMP) packets to every router involved in transferring the data between two points. It thus provides information about whether the routers used in the transmission can effectively transfer the data. This is a standard tool/test that every support person’s toolbox, as it indicates devices with network difficulties. Edge DX runs and captures this information and then displays the traceroute output in a widget (Figure 6).

Figure 6: Traceroute Latency
How Strong Is Your Signal
The WiFi Strength Samples widget (Figure 7) is a valuable tool to assess the overall health of a company’s Wi-Fi health and that of its end users. It allows you to identify Wi-Fi outages and issues that can significantly disrupt work, especially since Wi-Fi has become the preferred network connection method for many remote and office users.

Figure 7: Wi-Fi Signal Strength
The network is the most critical resource of a company; if it has any issues, it can and will significantly disrupt the work that gets done. The Network Latency Dashboard allows you to monitor aggregated networking information, dive into discrete devices, and investigate issues as needed. For more information, visit our Edge DX page or schedule a demo with a ControlUp sales engineer.