When trying to pin down the cause of an issue, sometimes you need to find a device or multiple devices with a common value, and doing so can be like trying to find a needle in a haystack. For example, if you suspect you have a group of users experiencing networking issues, and you think that problem may be tied to a segment of the network they are on, you could create a dashboard in Edge DX that displays the remote IP address. Then, you could filter on that IP address, or you could create a report with that information in it. Both of these techniques have use cases, but using a global filter gets this information easier and quicker, thereby allowing you to close tickets faster and give your end users a better desktop experience.
After I show you how powerful and easy global filters are, I will go back and talk about the other two ways you can obtain this information and discuss why you would choose one method over another. In each of these examples, I will be using the remote IP address scenario, but you should also be able to apply the same methodology of using global filters to help solve other problems.
If you suspect a problem with the network latency of all the devices on a network segment with an IP address whose first octet is 72, you see all the devices by clicking the Devices tab (See Figure 1).

Figure 1: Devices List
Even though this page does not have a remote IP address column, you can still search on it. To do this, you can create a global filter by clicking Add Filters in the upper left of the page (See Figure 2).
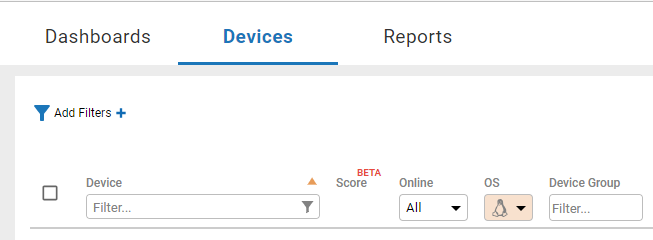
Figure 2: Devices Add Filters
From this dialog, you can select the column values that you would like to filter on (e.g., Remote IP Address), the matching criteria (e.g., like or begins with), and the value (72) (See Figure 3).

Figure 3: Edit Filter
When you click Apply Filters, only the devices that have that attribute will be displayed (See Figure 4).
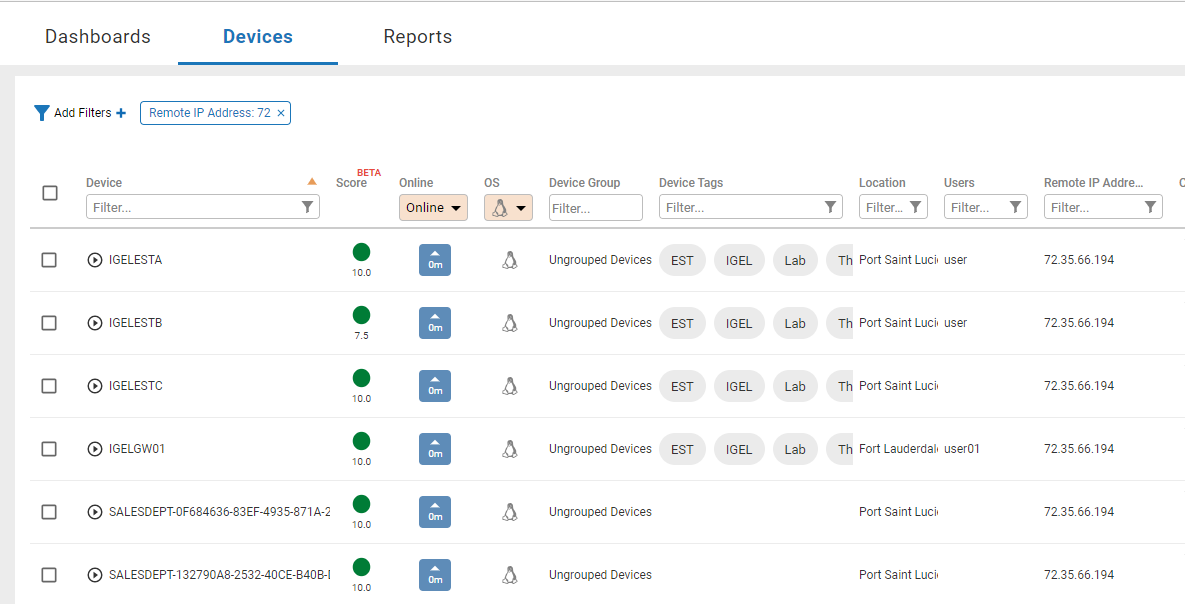
Figure 4: Apply Filters
With only four clicks, I was able to display all the devices on the network segment that I suspected had issues. I could click on any of the devices displayed to gather more information about them, or, if desired, I could run an action on all of them simultaneously to solve the issue (e.g., flush DNS) or gather more information about them.
If this is a recurring issue, I could create a custom dashboard that displays the remote IP address, or any other column that is not displayed in the default dashboard by selecting the “+” and creating a new dashboard, assigning it a name, and populating it with the values to be displayed (See Figure 5).
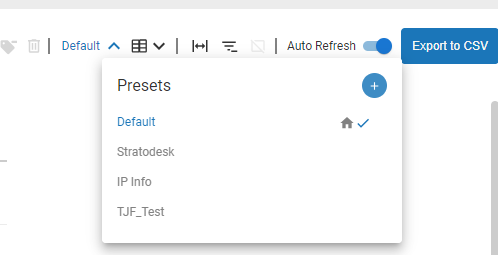
Figure 5: Presets
On this dashboard, I could then filter on the IP address of the devices that I wanted to search for (See Figure 6).
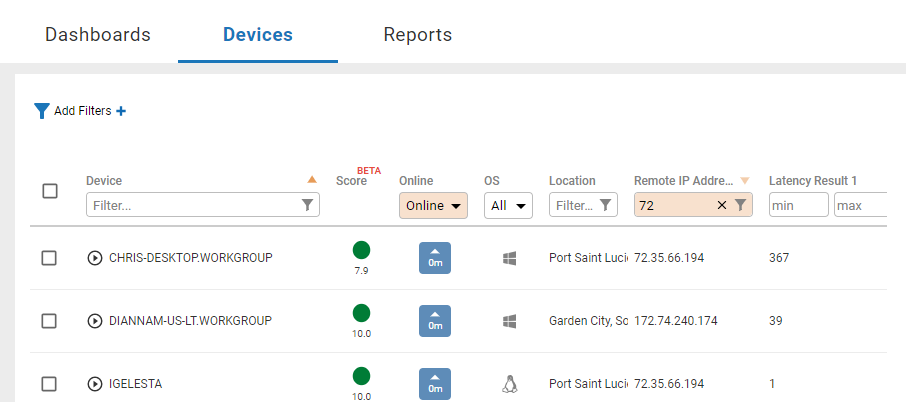
Figure 6: IP Filter
If you need a tabular report of these devices, you can create a report to display this information. However, as reports can only be run on a single data index, and the latency results are in one index and the remote IP address is in another, this is not easily doable for this particular case.
By using global filters, you can quickly display the devices that share a common criterion. You could also build a new dashboard that displays only the columns that are needed. Reports allow you to see, in a tabular form, the values that you desire, but the values that you want to display must be in the same index. Regardless of which method is right for your workflow, you will find that Edge DX allows you to close tickets faster and give your end users a better experience with their desktop devices.
For more information on how Edge DX helps IT teams find and fix desktop experience issues faster, visit our Edge DX page or schedule a demo with a ControlUp expert.