
Edge DX, which we just announced today, is both a natural extension for ControlUp and a departure from our historical lineup of products in terms of the mission it fulfills. As the name implies, Edge DX deals with physical endpoints rather than virtualized desktops, which we’ve always monitored in real time.
While ControlUp’s other products are geared towards monitoring and managing virtual desktops and the infrastructure on which they reside, Edge DX was designed from the ground up to monitor, manage, and troubleshoot physical endpoints.
While I am a huge fan of virtual desktops, there are many use cases for non-virtualized desktops, too. For instance, you may have users without—or with unreliable—networking. Other users may need compute resources, such as GPUs, large amounts of RAM and dedicated CPU cores, which don’t lend themselves to virtual desktops. Others may prefer desktops that run Linux or MacOS. There are even situations in which it might be necessary to monitor the physical clients that connect to the virtual desktops. But the most common situations we see are related to remote—what we call “work-from-anywhere”—employees and how Edge DX can help IT help them stay productive.
Because Edge DX is a SaaS application, you only need to install the agent on the devices that you want to monitor; the storage and processing of the data is all performed using ControlUp cloud resources. By using this architecture, additional on-premises infrastructure is not required. Perhaps more importantly, ControlUp handles all the care and maintenance of the infrastructure to support Edge DX, meaning that its customers can deploy and expand it easily.

Not only does Edge DX support Windows, Mac, and Linux devices, it does so without having to be connected to a corporate network or AD. To transfer data, it uses the same port as outbound web pages, which is seldom blocked. This allows for devices located on-site, in home-offices, mobile workers and even cloud deployed virtual desktops.
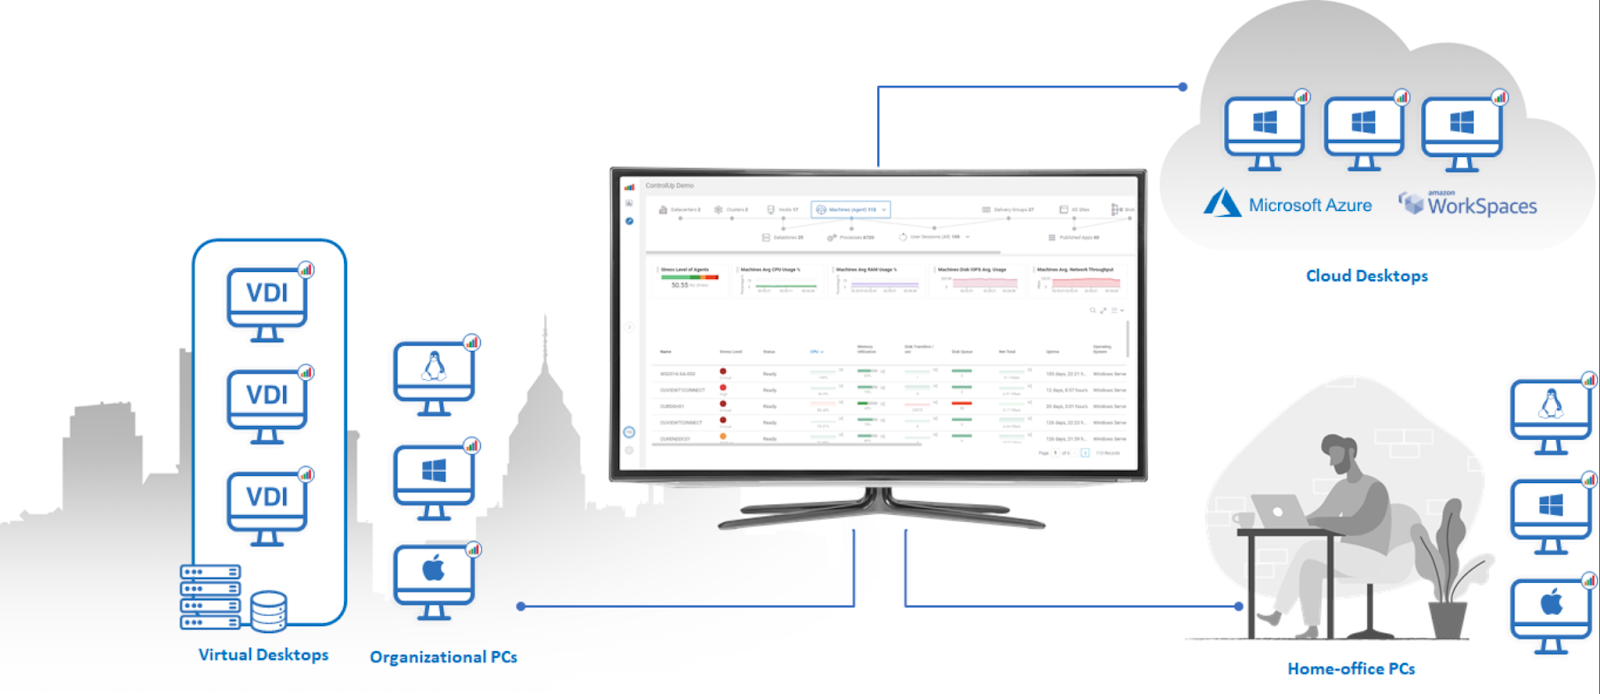
Edge DX can be accessed in a few different ways, but accessing it through ControlUp Solve is the simplest.

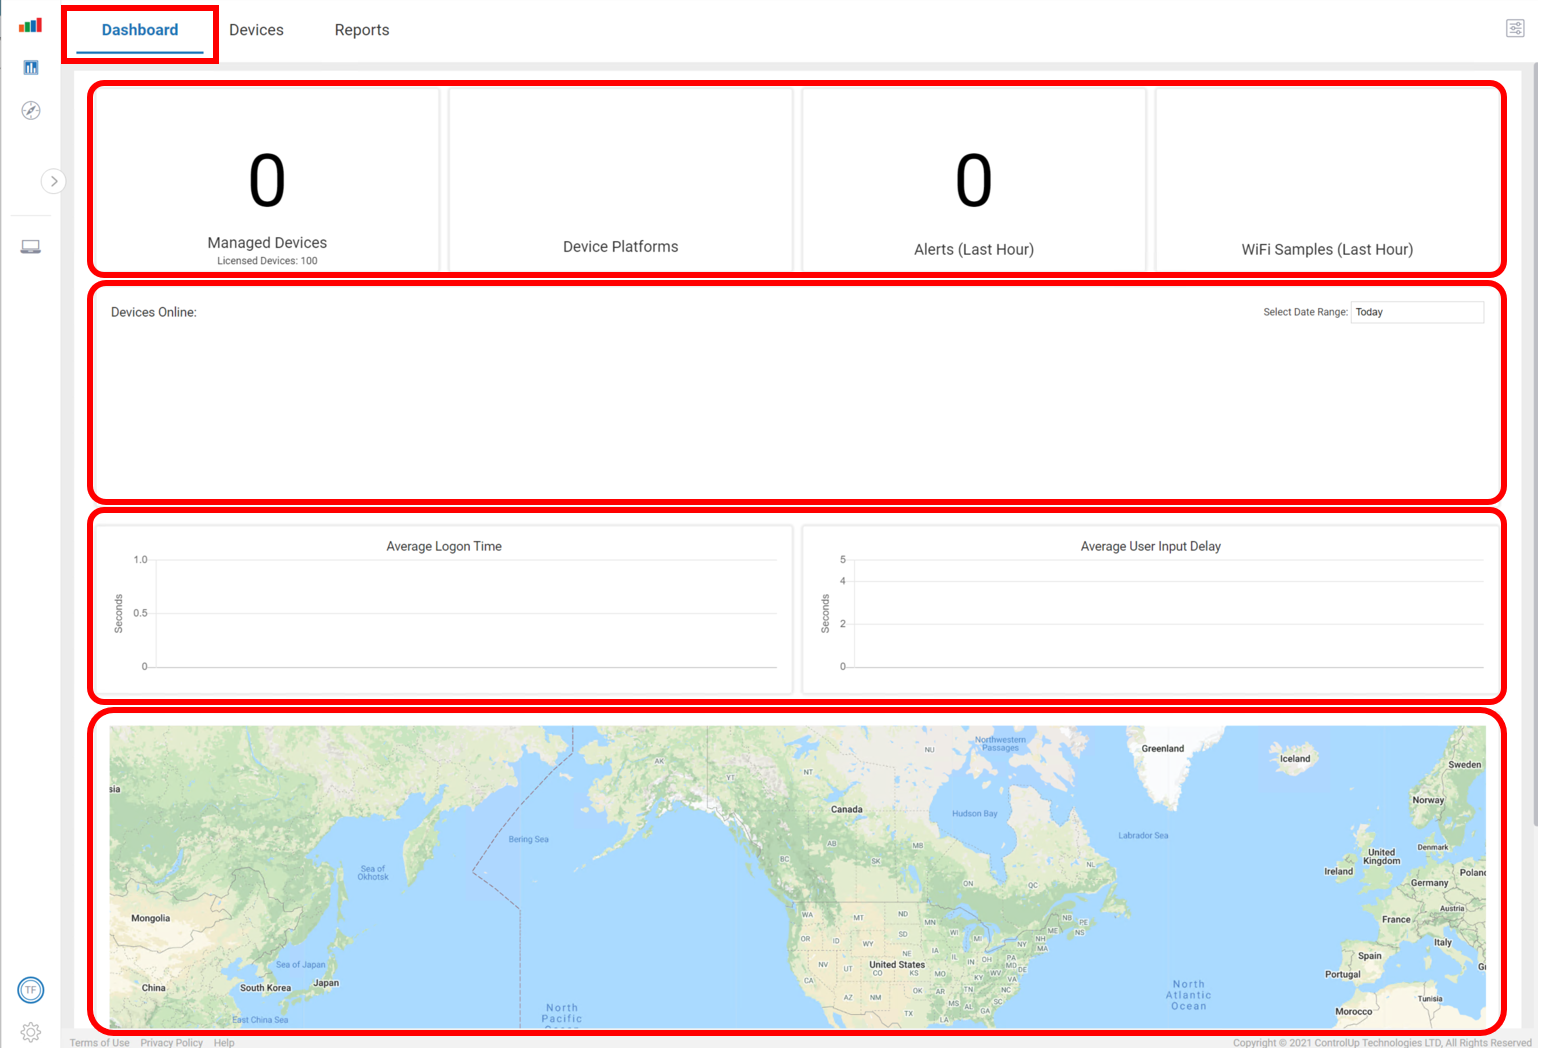
The Edge DX dashboard is divided into different sections composed of widgets that display various sorts of information.
Agents are placed on the devices that you want to have in your Edge DX environment. These agents and its device registration code can be downloaded directly from the Edge DX dashboard.

The Edge DX agent is installed via a Windows installer package. The agent is small, and it takes just seconds to install.
It may take a few minutes for the device to appear on the Edge DX Dashboard. Once it does, it will show the general location of the IP address of the device and an overview of its health.

Under the Devices tab, you will find a list of the devices that Edge DX recognizes, along with high level information about them.

To get in-depth information about a device, you can double-click it. This will display general static information about it in the upper portion of the screen, and performance metrics in the lower portion.

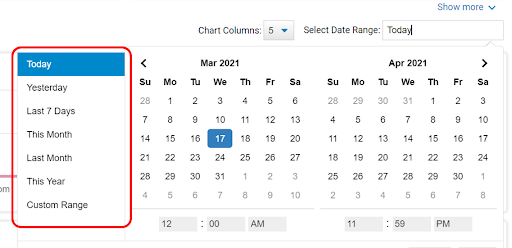
By default, the metrics are shown only for the current day, but you can specify other time ranges, if you like.
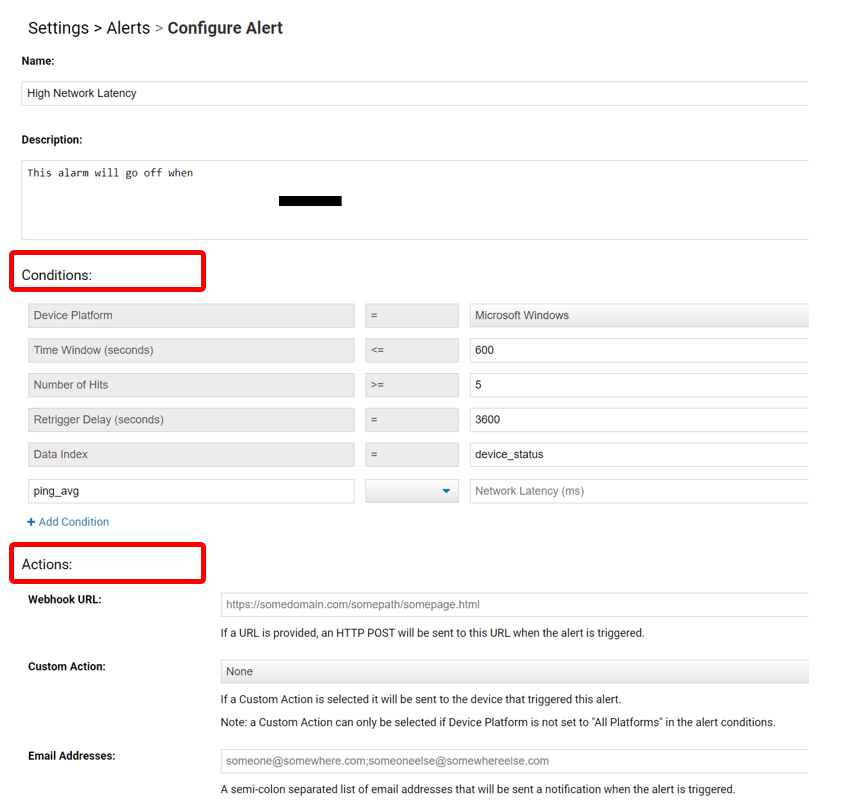
If you are concerned about a particular metric (for instance, network latency), you can click the alarm bell and create an alert for it.

Using the alert wizard, you can specify the conditions to trigger an alert and which actions should be performed. You can also specify how many times the condition occurs before setting off the alert. The actions can be web hooks, sending out an email, or specifying a predefined custom action.
You can see the active process, installed applications, missing patches, and events that occurred on the device.

Edge DX has preconfigured reports for the devices, applications, processes, and performance of the devices. You can generate your own reports, too.

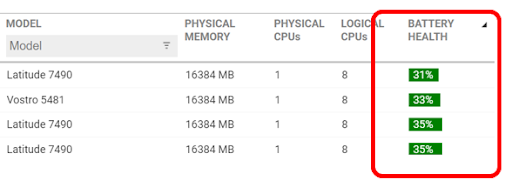
An example of a predefined report is one that shows which batteries in laptops are showing wear and should be replaced.
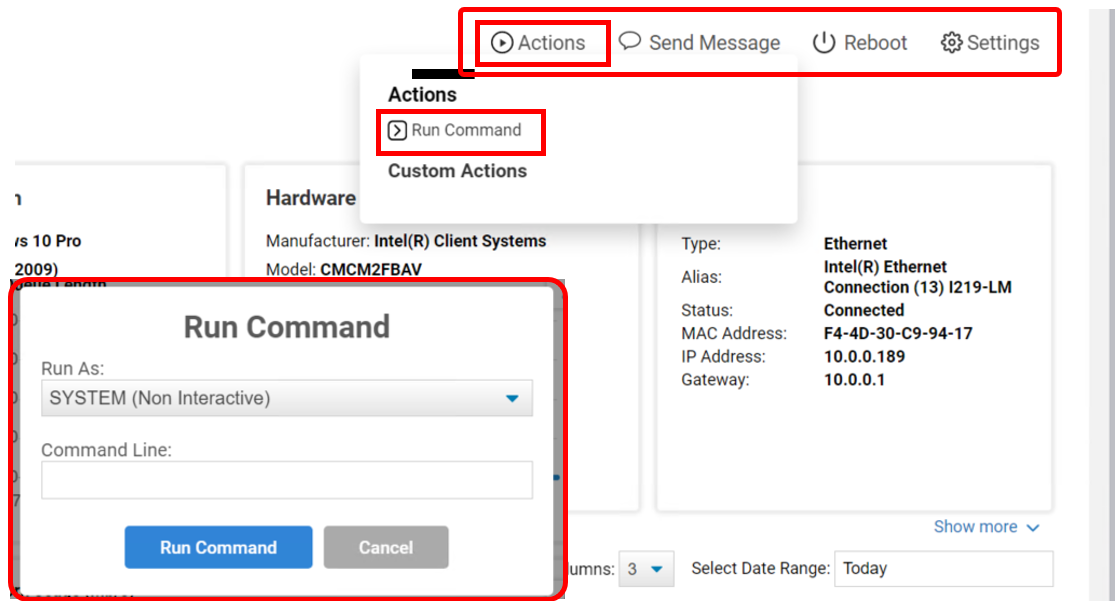
From Edge DX, you can reboot the system, send messages to it, or even run custom commands on it. These can be either system or user commands.
Edge DX is an important evolutionary step for ControlUp, giving IT more flexibility and control, and a true end-to-end view of their environments. To take Edge DX out for a spin, schedule a demo! We can’t wait to hear what you think.
