Explore expert insights, tips, and best practices to optimize your IT operations
Tap into a wealth of knowledge from your peers, industry experts, and the ControlUp team, deepening your understanding of ControlUp products and solutions.
ControlUp helps IT teams address common digital workplace experience challenges, no matter their use cases or existing technologies.
ControlUp offers a rich set of capabilities to improve the digital experience for employees using any desktop, any application, anywhere.
Explore expert insights, tips, and best practices to optimize your IT operations
Tap into a wealth of knowledge from your peers, industry experts, and the ControlUp team, deepening your understanding of ControlUp products and solutions.
A global organization of technology professionals transforming the desktop monitoring marketplace.

Purpose-built to enable IT to monitor and manage their end-users’ physical endpoints that run Windows, Linux, or macOS, ControlUp for Desktops gives IT pros a real-time understanding and optimization solution that deploys, at scale, in just minutes.
Edge DX has a powerful database that stores a vast amount of information about the devices it connects to. In this step-by-step guide, show you how to extend its value by using scripts.
In a previous blog post, we walked you through how to create custom reports in Edge DX. Since we’ll be jumping in where that piece left off, be sure to catch up on that before getting started here.Creating Scripts
ControlUp for Desktops collects commonly used metrics and stores them in a database. Many of our customers want to go beyond that and collect additional information from their physical endpoints. Using scripts, you can do exactly that. To create a script in Edge DX, click the Configuration icon in the upper right of the dashboard and select Scripts.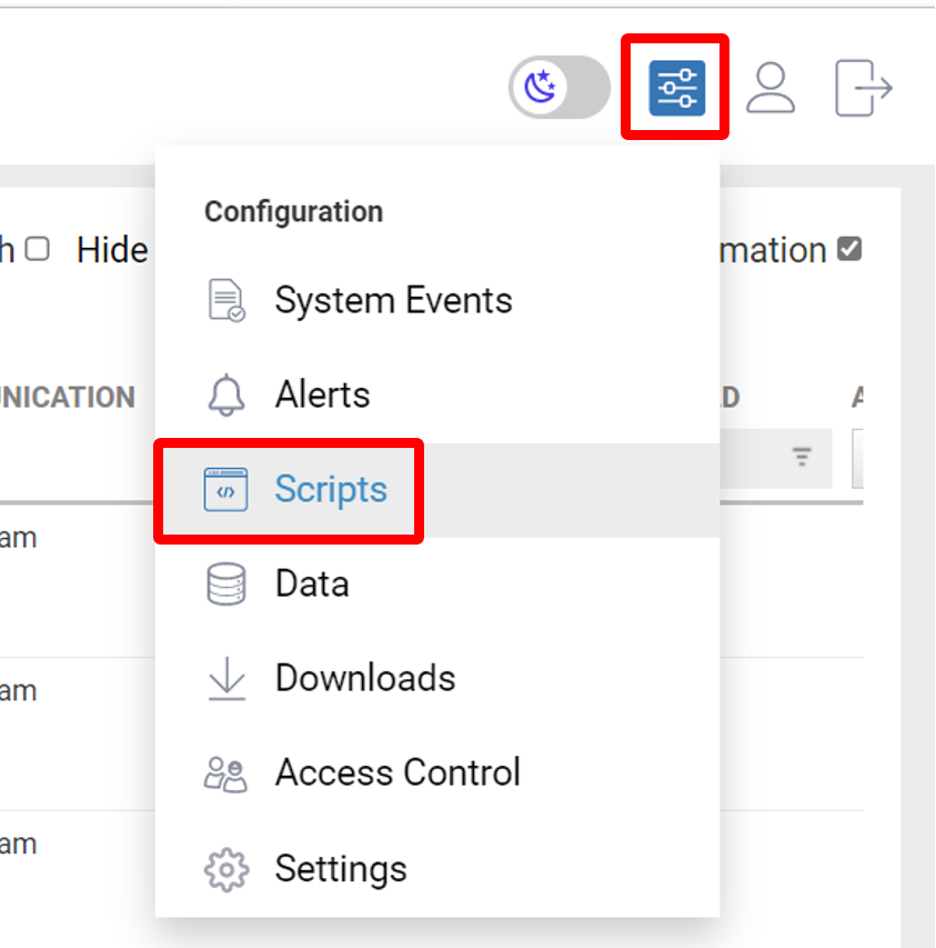 This will display the scripts that already exist. Click Add Script.
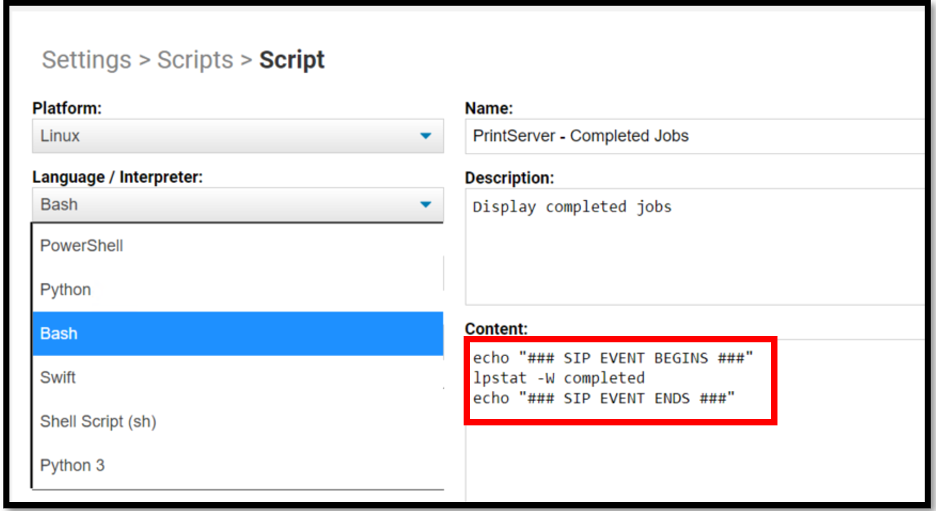
 From the pop-up window, select the OS you want the script to run on and language you want to use.
For this example, I will create a Bash script in Linux that will run lpstat -W completed to show the print jobs that have run on the device.
By putting commands between “### SIP EVENT BEGINS ###” and “### SIP EVENT ENDS ###” the output of the command will be displayed under Device Events. As the example below is a Bash script the echo command is used to output the language.
From the pop-up window, select the OS you want the script to run on and language you want to use.
For this example, I will create a Bash script in Linux that will run lpstat -W completed to show the print jobs that have run on the device.
By putting commands between “### SIP EVENT BEGINS ###” and “### SIP EVENT ENDS ###” the output of the command will be displayed under Device Events. As the example below is a Bash script the echo command is used to output the language.
 Scripts can either be run manually or automatically on a set schedule or by using a trigger. To run the script manually select the device that you want it to run on and then select the script from the Actions drop-down menu.
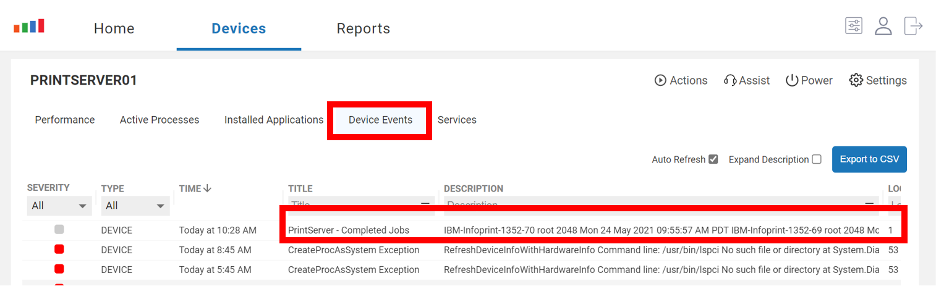
 Clicking Device Events will show you a one-line summary of the output of the script.
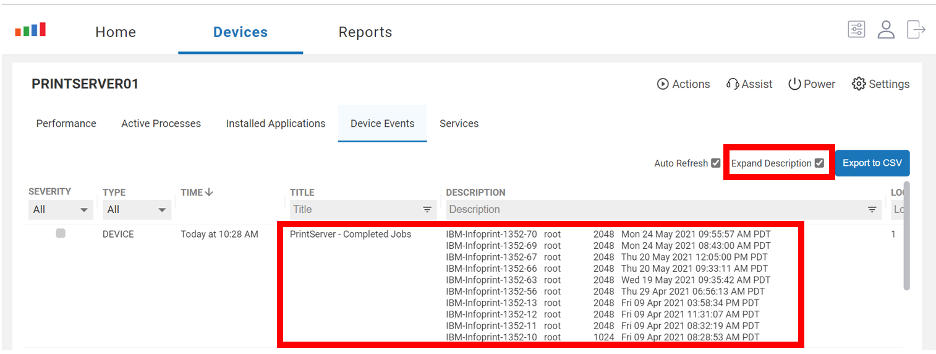
 By selecting Expand Description, you can see the complete output from the script.
Writing to the Edge DX Database
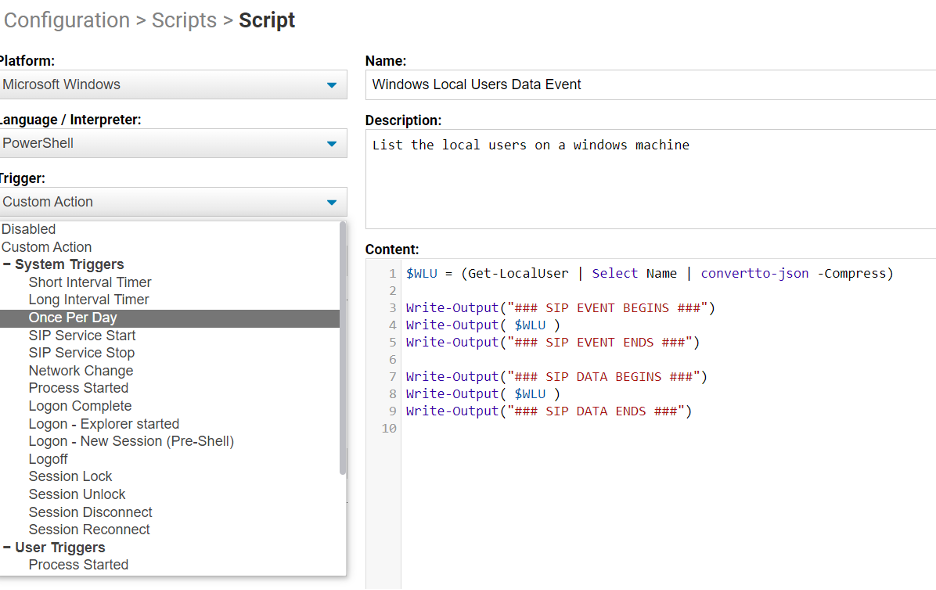
Edge DX supports writing user-created data to its database. In the following example, I will extract the local users on a Windows machine and write them to the database. As Edge DX supports scripting on all the OSes that it supports, the example below is of a Windows PowerShell script that will list all the local users on a Windows system.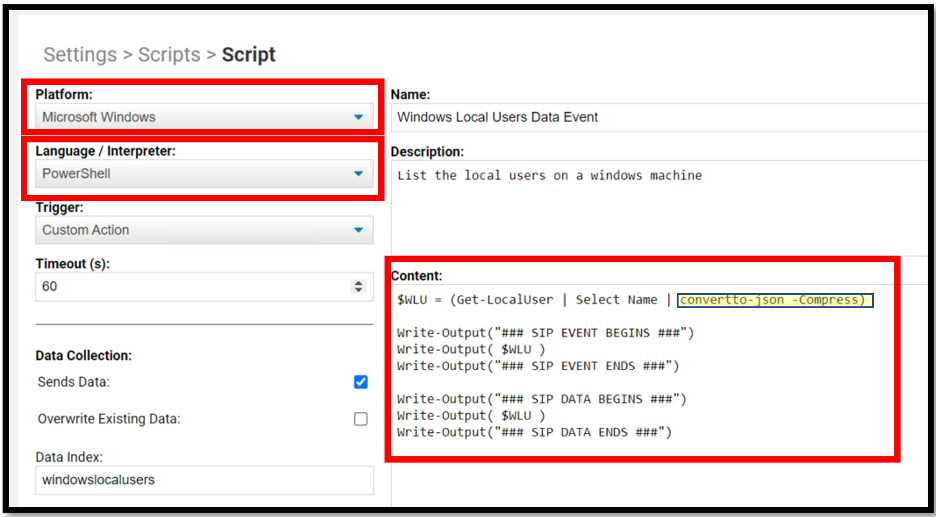 By putting the information that you want written to the database between “### SIP DATA BEGINS ###” and “### SIP DATA ENDS ###” and selecting the Sends Data checkbox, and entering a name in (i.e., windowslocalusers) in the Data Index text box it will write the output to Edge DX’s database. The output needs to be in a json format, so I used the PowerShell Convertto-json cmdlet to convert the text output to it.
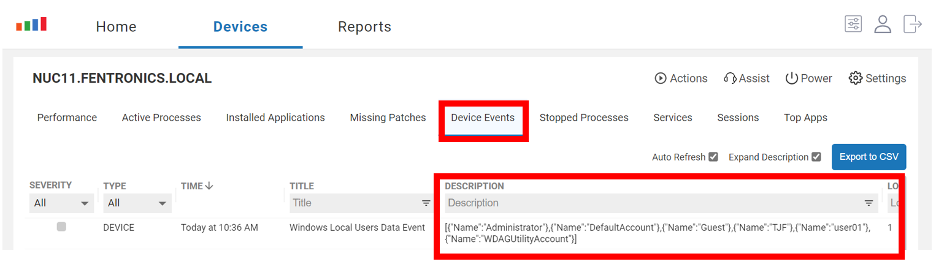
I ran the script, and it displayed the data, as expected in Device Events, as I also used SIP EVENT’s to output this data.
By putting the information that you want written to the database between “### SIP DATA BEGINS ###” and “### SIP DATA ENDS ###” and selecting the Sends Data checkbox, and entering a name in (i.e., windowslocalusers) in the Data Index text box it will write the output to Edge DX’s database. The output needs to be in a json format, so I used the PowerShell Convertto-json cmdlet to convert the text output to it.
I ran the script, and it displayed the data, as expected in Device Events, as I also used SIP EVENT’s to output this data.
Creating a Custom Report
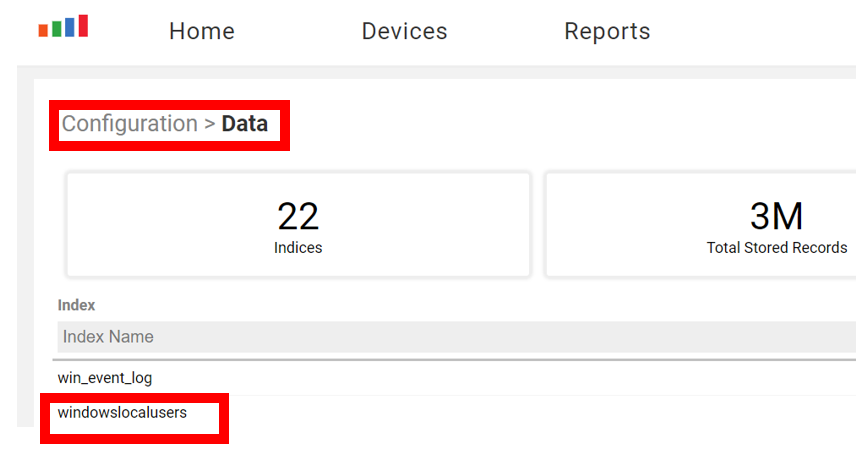
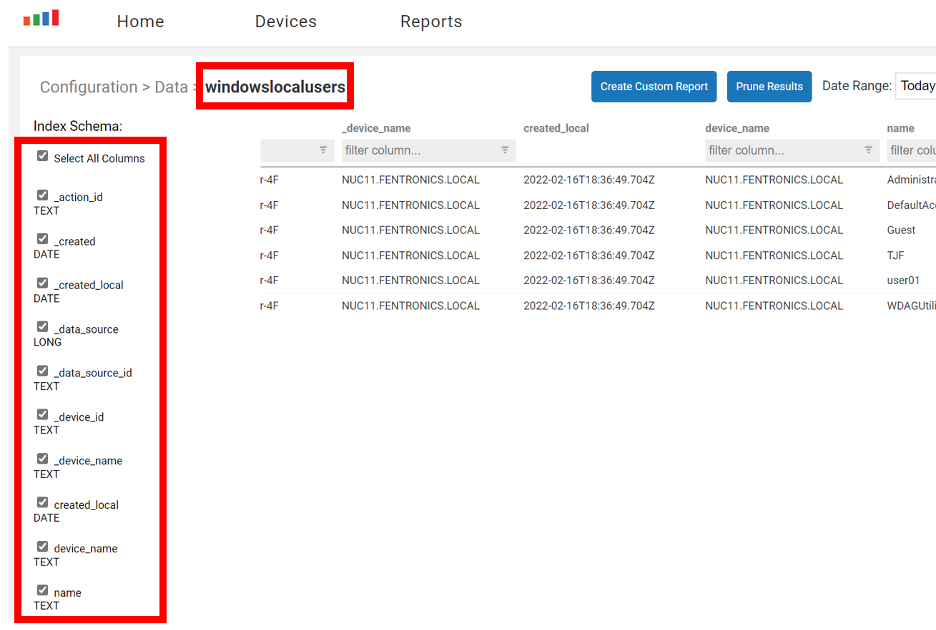
The script wrote the data to the Edge DX database as well as Device Events. To access the data that was stored select Data from the Configuration drop down-menu.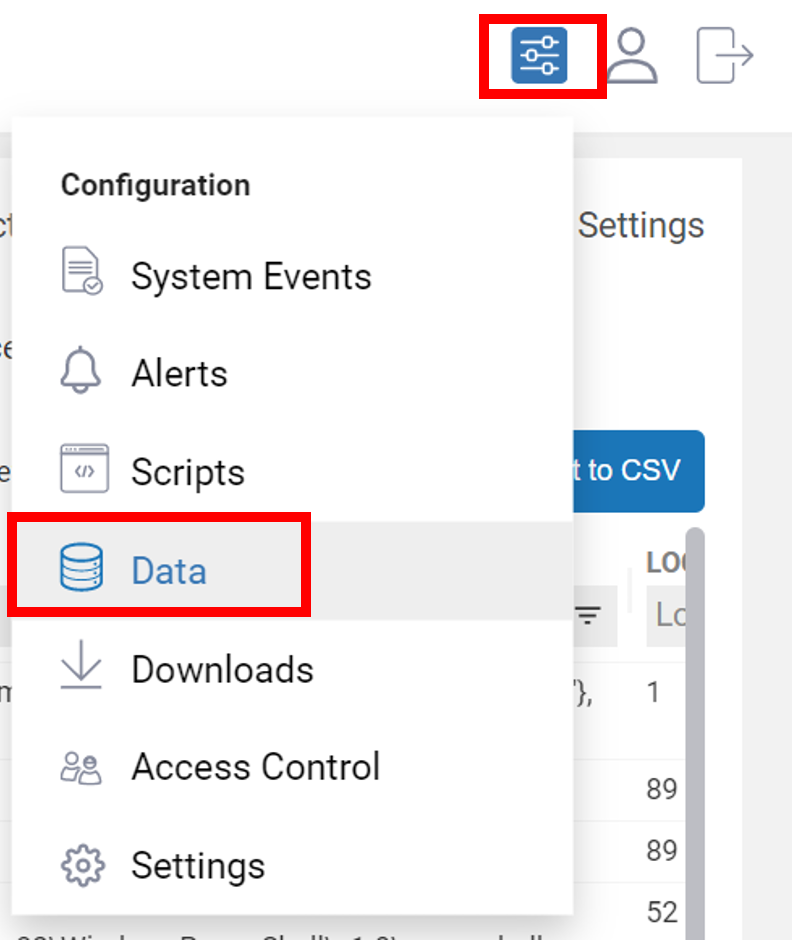 Select the index that the data was stored in (windowslocalusers).
 The index schema not only shows the local users, but also metadata such as the time the information was created and the machine from where it came from. You can select the items you want to display from the index schema.
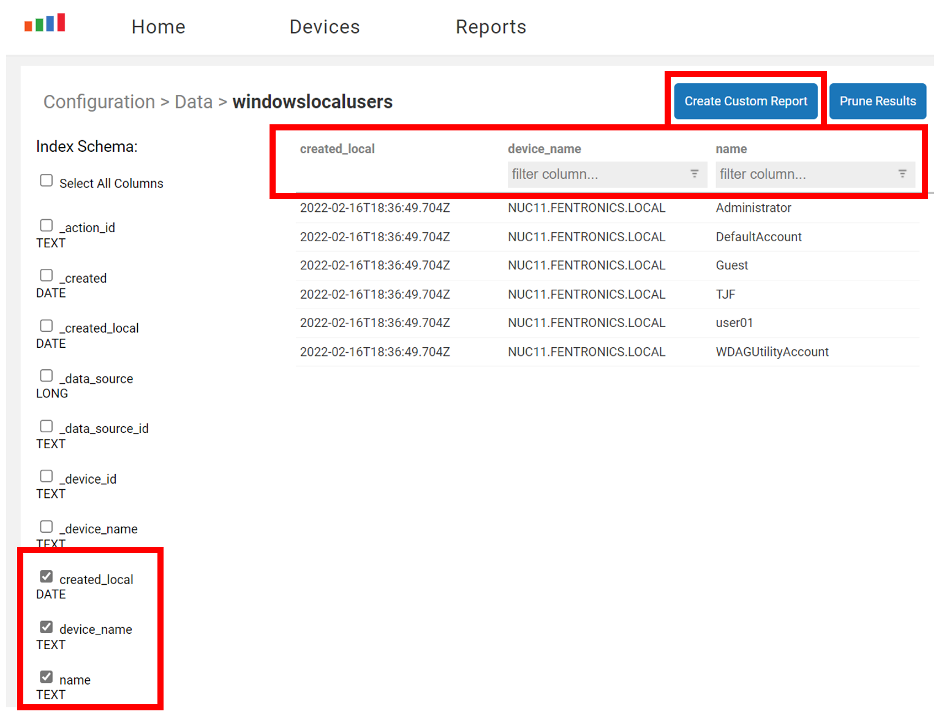
 If you want to view this information on a regular basis you can create a report. To do this select the fields that you want to display from the index scheme and then select Create Custom Report.
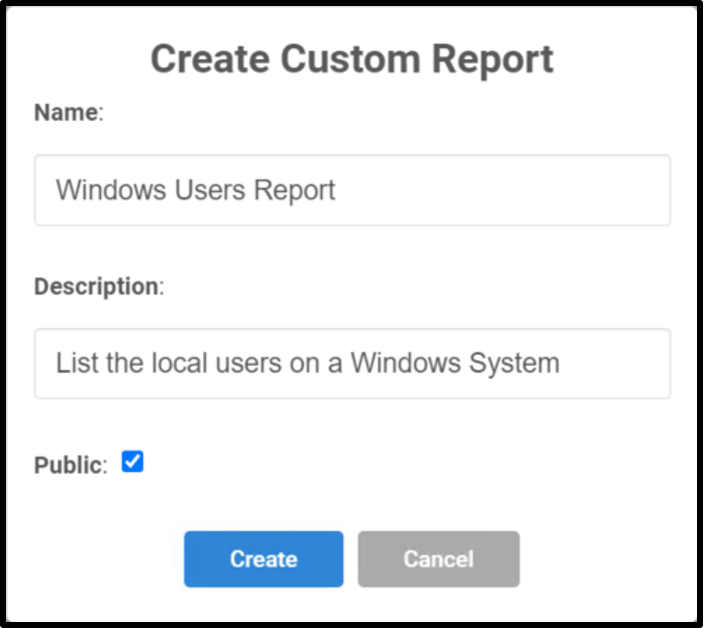
 This will bring up a pop-up where you enter the name and a description of the report, and then click Create.
 This will bring up a pop-up where you enter the name and a description of the report, and then click Create.
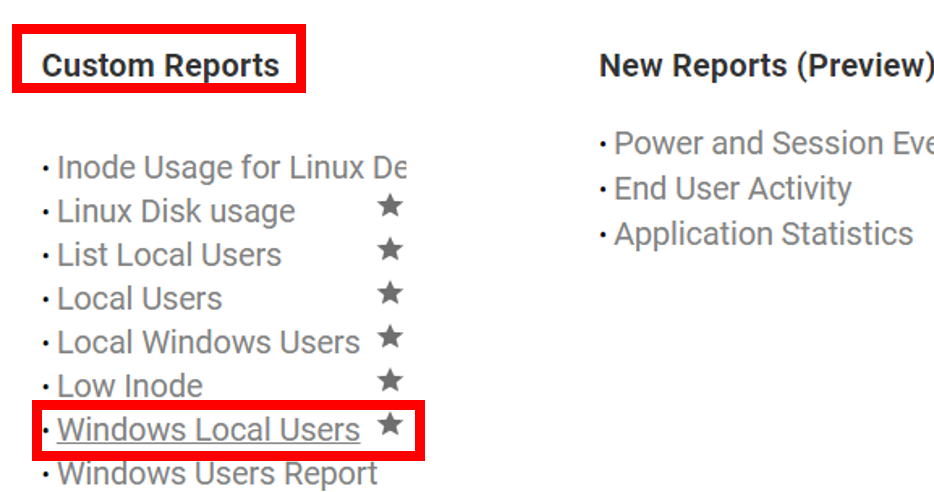
 After refreshing the webpage, you will see this report under the Custom Reports column.
 If you want to run the report on a set schedule for all your Windows devices you can set a trigger for it. To do this edit the script and select how often you want to run it (e.g., Once Per Day) from the Trigger drop-down menu. Apart from time schedules, the trigger menu has over two-dozen other events that can trigger alerts, such as when a user logs on or off, when a process is started, etc.
 Now, the script we created will collect the users from all the Windows machines and load it into its database.
In these two articles, we showed you how ControlUp for Desktops collects hundreds of metrics from your devices in its database and we showed how you can add additional data. You can use this information to create ad hoc reports, create reusable custom reports and even run these reports on a regular basis.
Now, the script we created will collect the users from all the Windows machines and load it into its database.
In these two articles, we showed you how ControlUp for Desktops collects hundreds of metrics from your devices in its database and we showed how you can add additional data. You can use this information to create ad hoc reports, create reusable custom reports and even run these reports on a regular basis.