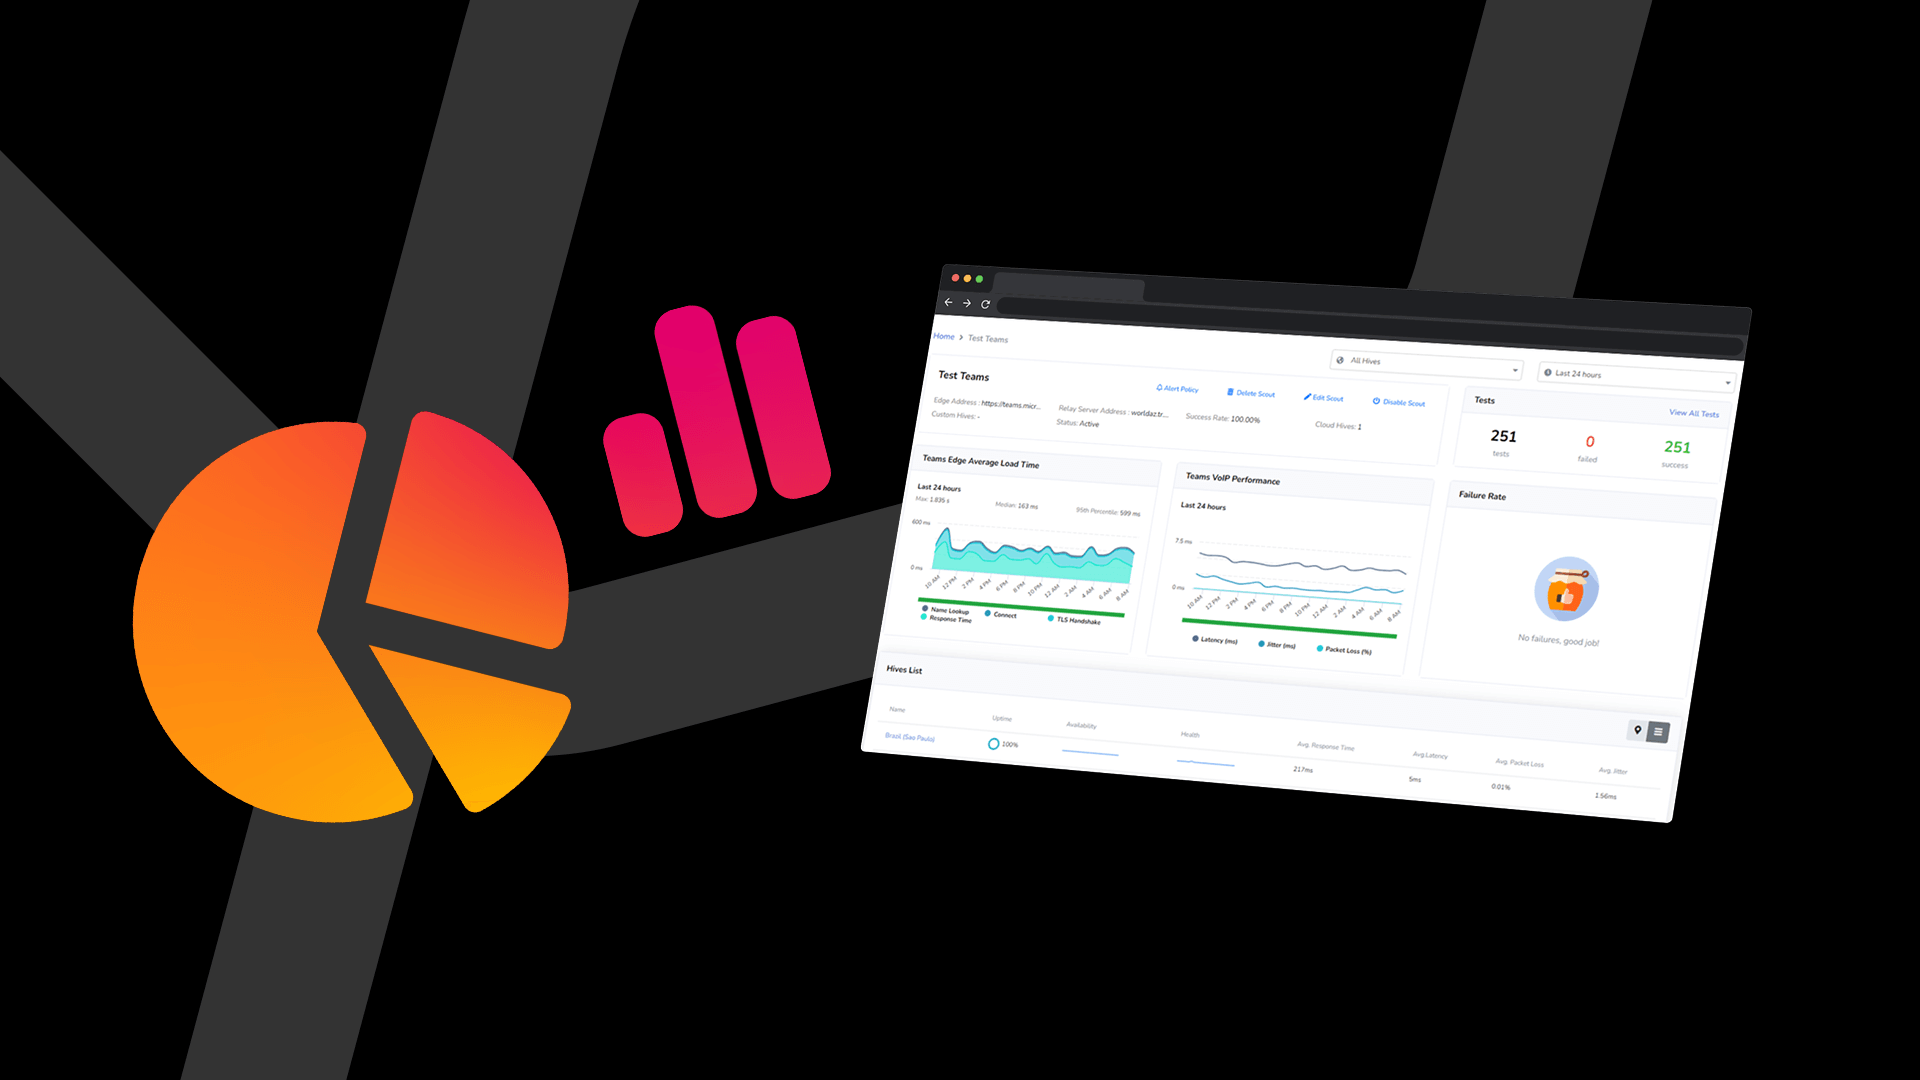
In part one of this three-part series, we discussed solving desktop support issues faster. For part two, we will discuss reducing the number of support tickets.
Part One: Close physical desktop support tickets faster.
Part Three: Save money by consolidating physical desktop support tools.
Part Two: Have fewer physical desktop support tickets.
Many organizations are flooded with desktop support tickets, which leads them to adopt self-help software to reduce the volume. When self-help software doesn’t solve a user’s problem, they get even more frustrated to open a support ticket anyway. At ControlUp, we focus on detecting and automatically fixing the issue before the problem gets escalated to a support ticket. While automation may sound too good to be true, consider the sheer number of recurring problems with known solutions. ControlUp can proactively detect those issues and automatically deploy a solution to avert a ticket from ever being created.
Notifications
ControlUp has two notification mechanisms to reduce helpdesk calls: 1) notify users about services, and 2) help a user by recommending steps to help themselves.
Notifications about services
When a web service or application goes down or has problems such as scalability, the helpdesk can get flooded with calls because each user thinks the problem is with them. The employee will try troubleshooting the problem themselves, losing productivity, and then, after wasting time, call the helpdesk. ControlUp uses continuous synthetic transaction testing to alert users and IT when the availability or performance of web services and applications are impacted, thus also resulting in fewer helpdesk calls and tickets.
 Figure 1: Screenshot displaying notifications about services in ControlUp.
User behavior makes up a large portion of support calls. For example, having too many browser tabs open leading to low available memory, or resting a laptop on a pillow and overheating the CPU, or working in different locations around the house, experiencing sporadic poor Wi-Fi during the workday. ControlUp collects thousands of desktop metrics and allows you to add custom metrics to the cloud database. When a configured event happens, ControlUp sends a pop-up message to the desktop to notify the user to change a behavior, such as closing some browser tabs or move closer to the Wi-Fi router. Below let’s examine a use case to understand notification for self-help.
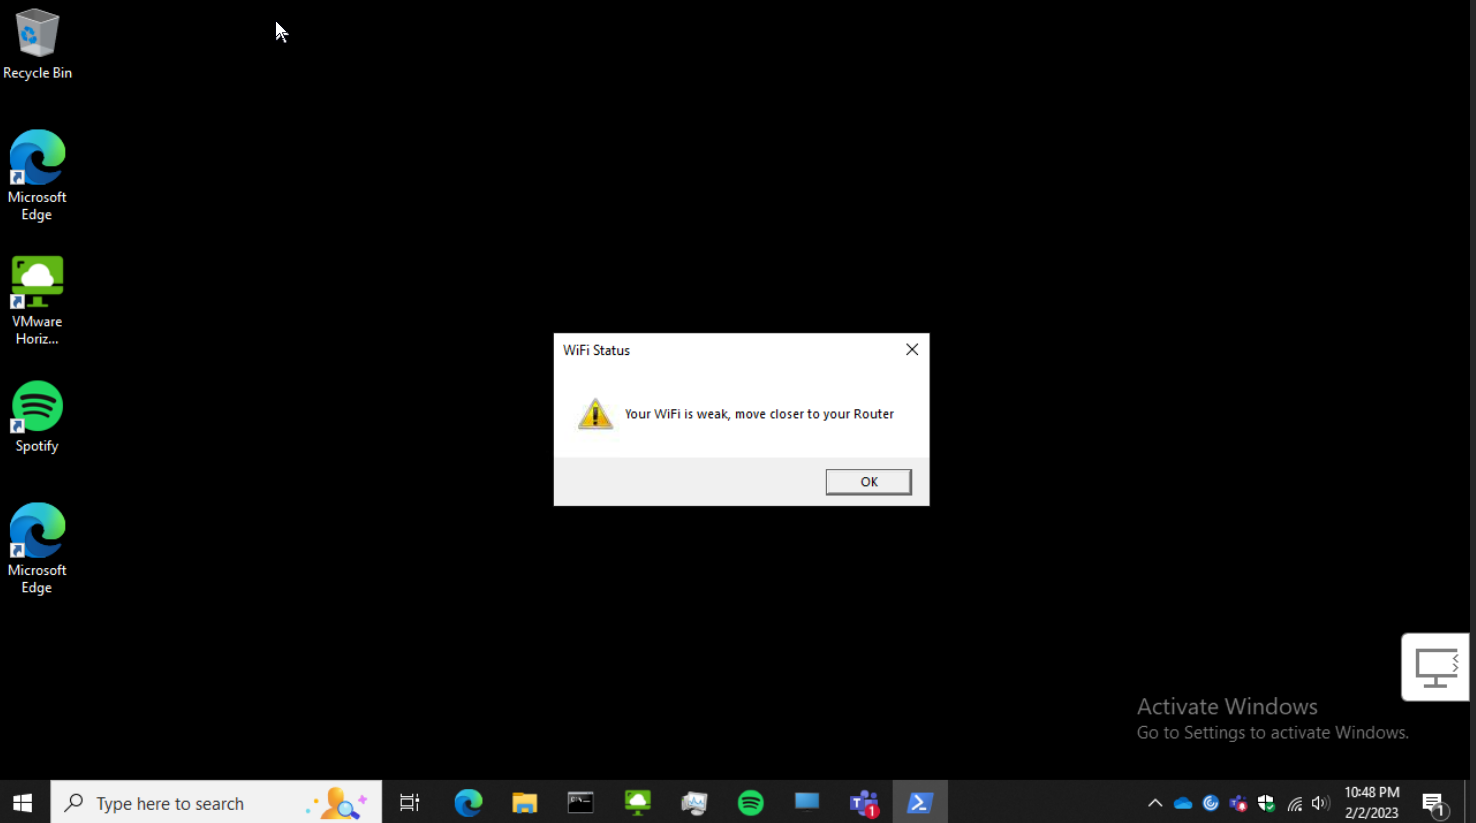 Figure 2: Screenshot displaying a notification of a desktop issue configured using ControlUp.
Automated remediation
It can waste a lot of time solving the same problems repeatedly, especially when they can be automated with the same solution. ControlUp can programmatically detect a problem to known issue and deploy a remediation script before the user knows there is a problem. Let’s explore another use case to understand automated remediation.
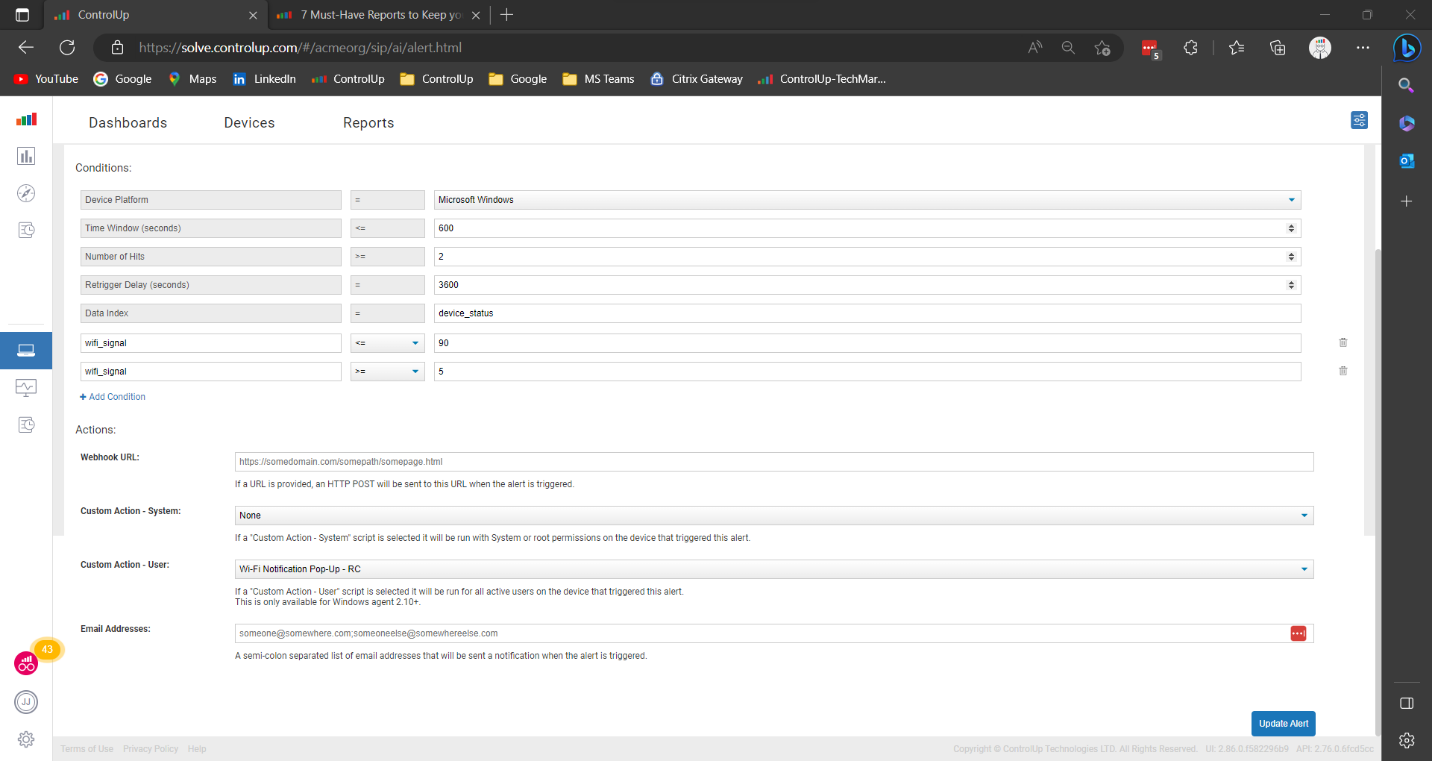 Figure 3: Screenshot of configuring alerts in ControlUp.
Proactive identification of problems
Sometimes you need to see all the trees in the forest picture to understand where the problems are. Too often, we get caught up in day-to-day troubleshooting and remediation, and we can’t see how many users, computer types, or geographic areas are having issues. ControlUp health data is presented in easy-to-consume maps, graphs, and charts to get an overview of the computer and user health.
The Edge DX home dashboard shows geographical map-based device statistics for all devices. The map view shows all devices in color-coded metrics such as User logon duration, Wi-Fi signal strength, Network latency, User input delay, CPU Load, Memory available, and Device location.
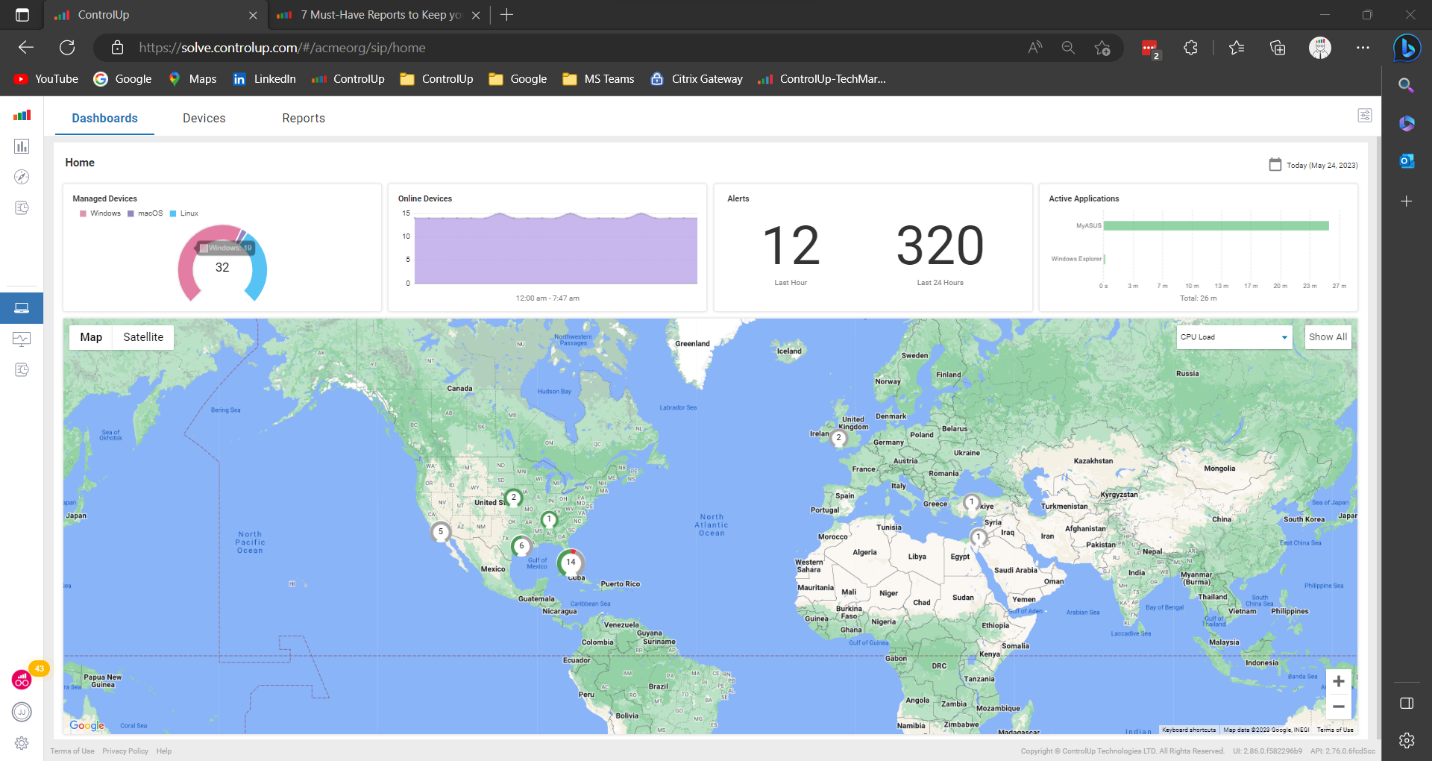 Figure 4: Screenshot of Edge DX home dashboard
Edge DX brings critical user experience metrics into one dashboard so that you can understand who is experiencing long logon durations, long application launch times, high input delay, and identify devices with the most reboots, blue screens, and the highest average CPU.
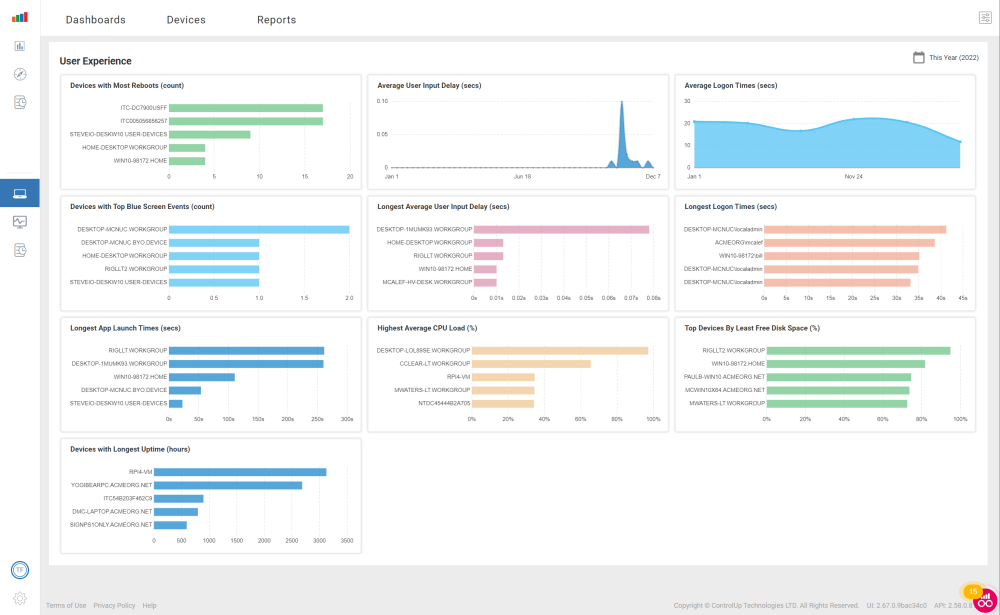 Figure 5: Screenshot of the User experience dashboard
Edge DX provides detailed network data to help you quickly and proactively identify problems affecting remote users. Included in this data are desktop networking metrics like Wi-Fi signal strength, Latency by device, Latency by ISP, and Longest traceroute hops.
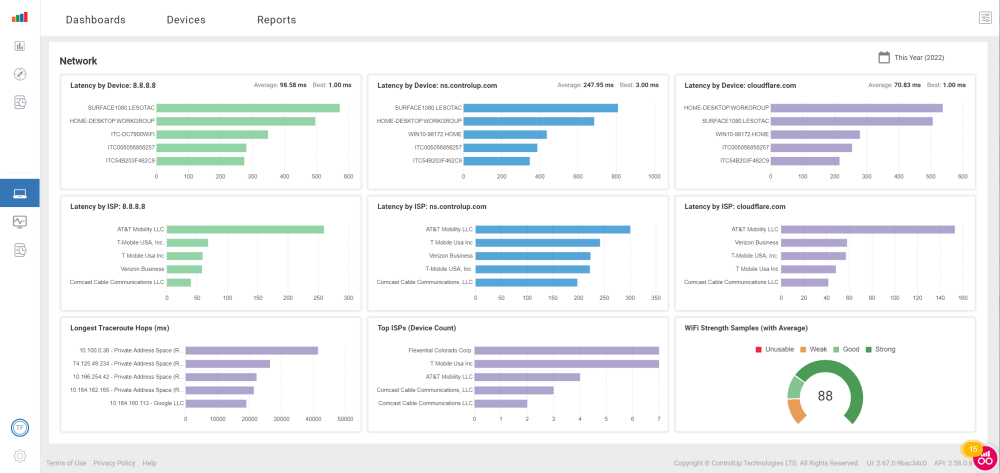 Figure 6: Screenshot of the Network dashboard in ControlUp.
The Edge DX Device Averages dashboard gives you a benchmark to understand if one device is better than the average of all devices. With this dashboard, you can view the devices with the worst battery health, most blue screens, least free disk space, and averages over time, such as CPU usage, CPU queue length, and memory usage.
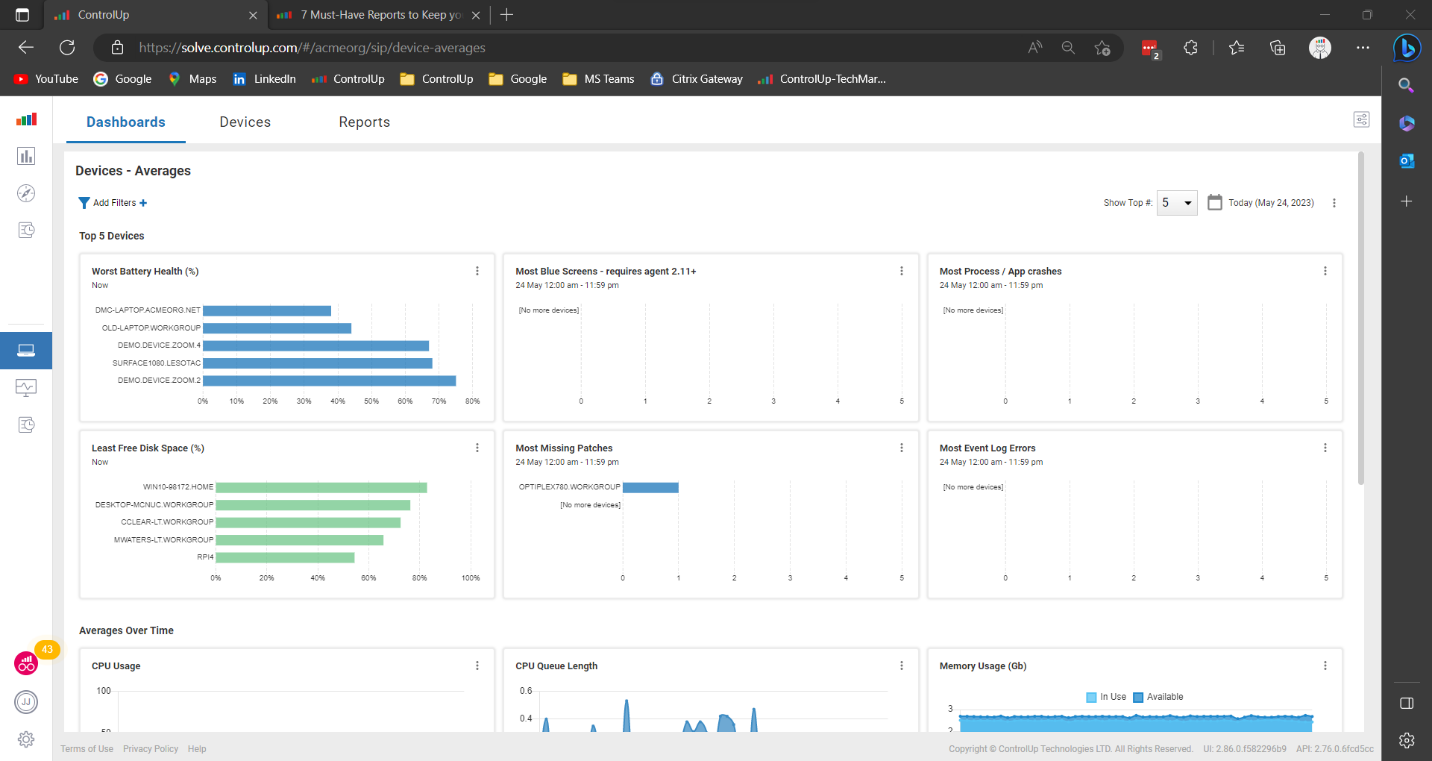 Figure 7: Screenshot of the Device – Averages Dashboard in ControlUp.
The best support ticket is the one that never happened. When a problem is detected and corrected automatically, IT teams and users have a better desktop experience and can focus on more pressing business objectives. If an issue requires remediation assistance, users can be proactively notified by ControlUp through auto-detection, remediation, and alerting capabilities, and we provide guidance on how to fix it. All ways that ControlUp can reduce helpdesk tickets, saving time and valuable resources for your organization.
For more information:
 Figure 1: Screenshot displaying notifications about services in ControlUp.
User behavior makes up a large portion of support calls. For example, having too many browser tabs open leading to low available memory, or resting a laptop on a pillow and overheating the CPU, or working in different locations around the house, experiencing sporadic poor Wi-Fi during the workday. ControlUp collects thousands of desktop metrics and allows you to add custom metrics to the cloud database. When a configured event happens, ControlUp sends a pop-up message to the desktop to notify the user to change a behavior, such as closing some browser tabs or move closer to the Wi-Fi router. Below let’s examine a use case to understand notification for self-help.
- Company A receives fifty support calls monthly because the internet connection is so inconsistent that they cannot use many business applications. IT support has determined that many of these calls are due to a weak Wi-Fi signal.
- Company A configured ControlUp to notify users to move closer to the Wi-Fi router when Wi-Fi is less than 60%, freeing up IT support to focus on more urgent IT issues.
 Figure 2: Screenshot displaying a notification of a desktop issue configured using ControlUp.
Automated remediation
It can waste a lot of time solving the same problems repeatedly, especially when they can be automated with the same solution. ControlUp can programmatically detect a problem to known issue and deploy a remediation script before the user knows there is a problem. Let’s explore another use case to understand automated remediation.
- Company A employees regularly create support calls about desktop performance. IT support has determined that a business application has a memory leak.
- Company A configured ControlUp to detect when the application has consumed X amount of memory to notify the user that the application will be re-started during idle time.
 Figure 3: Screenshot of configuring alerts in ControlUp.
Proactive identification of problems
Sometimes you need to see all the trees in the forest picture to understand where the problems are. Too often, we get caught up in day-to-day troubleshooting and remediation, and we can’t see how many users, computer types, or geographic areas are having issues. ControlUp health data is presented in easy-to-consume maps, graphs, and charts to get an overview of the computer and user health.
The Edge DX home dashboard shows geographical map-based device statistics for all devices. The map view shows all devices in color-coded metrics such as User logon duration, Wi-Fi signal strength, Network latency, User input delay, CPU Load, Memory available, and Device location.
 Figure 4: Screenshot of Edge DX home dashboard
Edge DX brings critical user experience metrics into one dashboard so that you can understand who is experiencing long logon durations, long application launch times, high input delay, and identify devices with the most reboots, blue screens, and the highest average CPU.
 Figure 5: Screenshot of the User experience dashboard
Edge DX provides detailed network data to help you quickly and proactively identify problems affecting remote users. Included in this data are desktop networking metrics like Wi-Fi signal strength, Latency by device, Latency by ISP, and Longest traceroute hops.
 Figure 6: Screenshot of the Network dashboard in ControlUp.
The Edge DX Device Averages dashboard gives you a benchmark to understand if one device is better than the average of all devices. With this dashboard, you can view the devices with the worst battery health, most blue screens, least free disk space, and averages over time, such as CPU usage, CPU queue length, and memory usage.
 Figure 7: Screenshot of the Device – Averages Dashboard in ControlUp.
The best support ticket is the one that never happened. When a problem is detected and corrected automatically, IT teams and users have a better desktop experience and can focus on more pressing business objectives. If an issue requires remediation assistance, users can be proactively notified by ControlUp through auto-detection, remediation, and alerting capabilities, and we provide guidance on how to fix it. All ways that ControlUp can reduce helpdesk tickets, saving time and valuable resources for your organization.
For more information:
- Blog: Seven must-have reports to keep your users productive
- Blog: Devices dashboard
- Video: What’s new with Scoutbees
- Video: Device averages
- Video: Network performance dashboards
